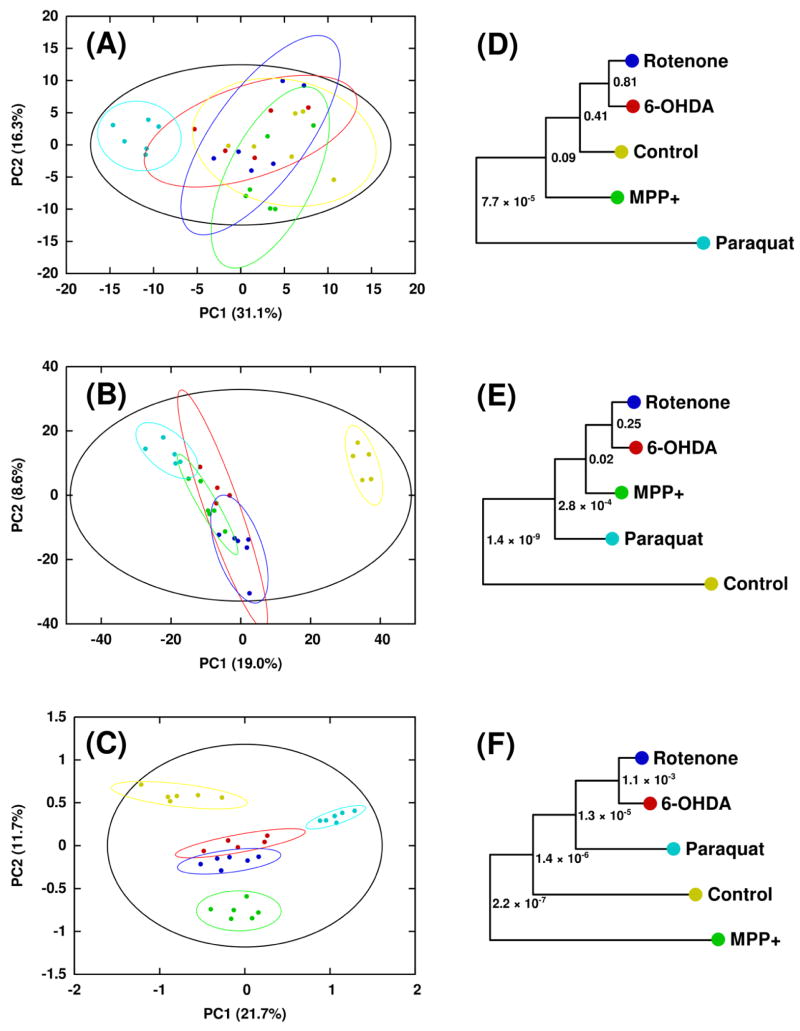
Figure 2.
Scores generated from (A) PCA of 1H NMR in vacuo, (B)
PCA of DI-ESI-MS in vacuo, and (C) MB-PCA of 1H NMR
and DI-ESI-MS. Separations between classes are greatly increased upon
combination of the two datasets via MB-PCA. Symbols designate the following
classes: Control (  ), Rotenone (
 ), 6-OHDA (
  ), MPP+ (
  ), and Paraquat (
  ).Corresponding dendrograms are shown in
(D–F). The statistical significance of each node in the dendrogram is
indicated by a p value (Worley,
Halouska, Powers 2013).

