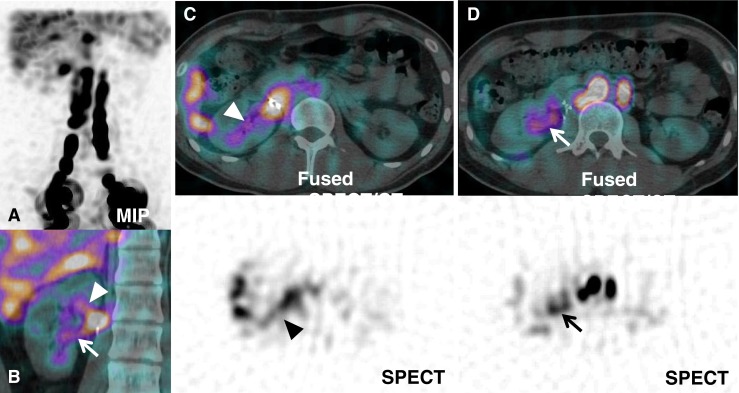
Fig. 2.

SPECT/CT image was acquired from the upper margin of liver to the iliac crest level, after acquisition of the 1-h lymphoscintigraphy planar image. a MIP image shows asymmetrical uptake in the right kidney. b In the SPECT/CT coronal view, lymphatic flow to the right kidney (arrowhead) and radiotracer accumulation in renal pelvis (arrow) is visualized. c From the axial view, radiotracer accumulation is shown in the ligation site and from here lymphatic drainage to the right kidney is also well visualized, indicating the lymphatico-renal communication (arrowhead). d Radiotracer excretion through the renal pelvis (arrow) is visualized
