
Fig. 3.
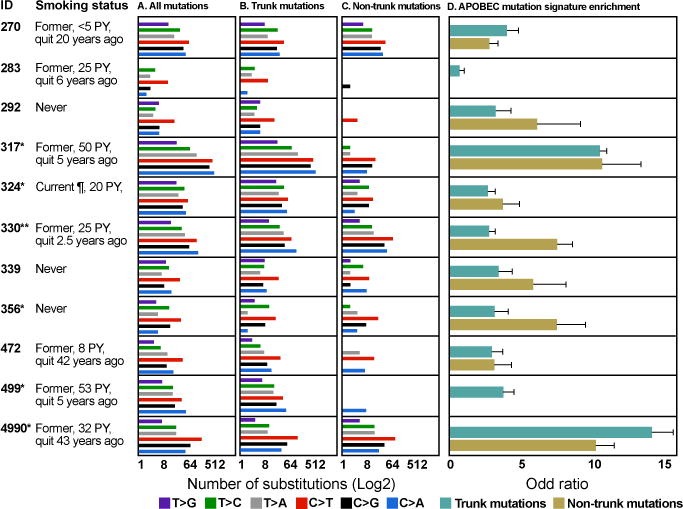
Mutation spectrum of the 11 lung adenocarcinomas. (A) Mutation spectrum of all validated mutations. (B) Mutation spectrum of trunk mutations. (C) Mutation spectrum of non-trunk mutations. The difference of mutation spectrum between trunk and non-trunk mutations in each patient was evaluated with Fisher’s exact test and significant p values are shown as *(P<0.05) and **(P<0.01). (D) APOBEC mutation signature enrichment odds ratio for trunk and non-trunk mutations. 95% confidence intervals for Fisher’s exact test are indicated. PY: pack year. ¶: Patient had cut down to 2 cigarettes a day at the time of cancer diagnosis.