
Figure 3.
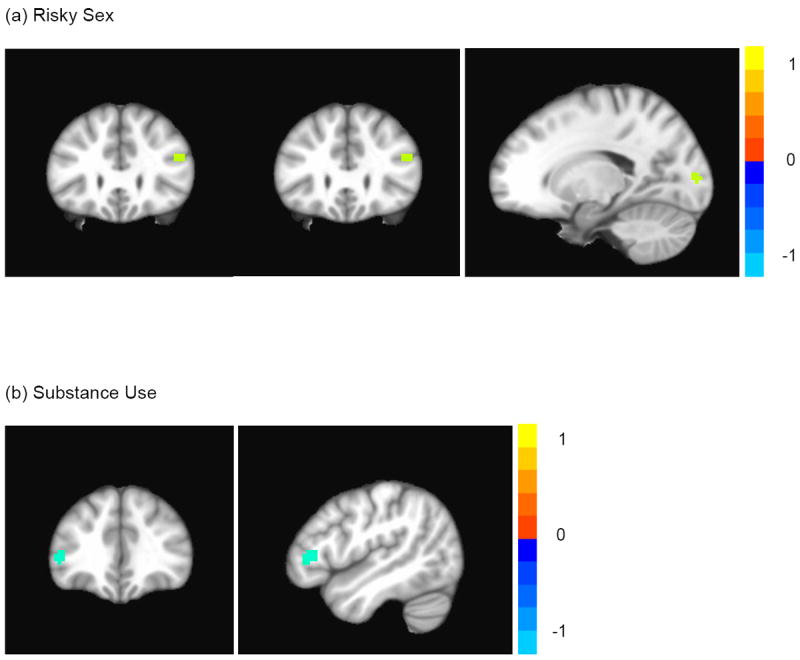
Relationship between past month risk behavior and response inhibition (NoGo > Go; uncorrected p < .001; extent threshold ≥ 10 voxels). The color bar indicates t values with warmer colors denoting positive correlations, and cooler colors denoting negative correlations. Figures use neurological convention (left hemisphere is shown on left side.)