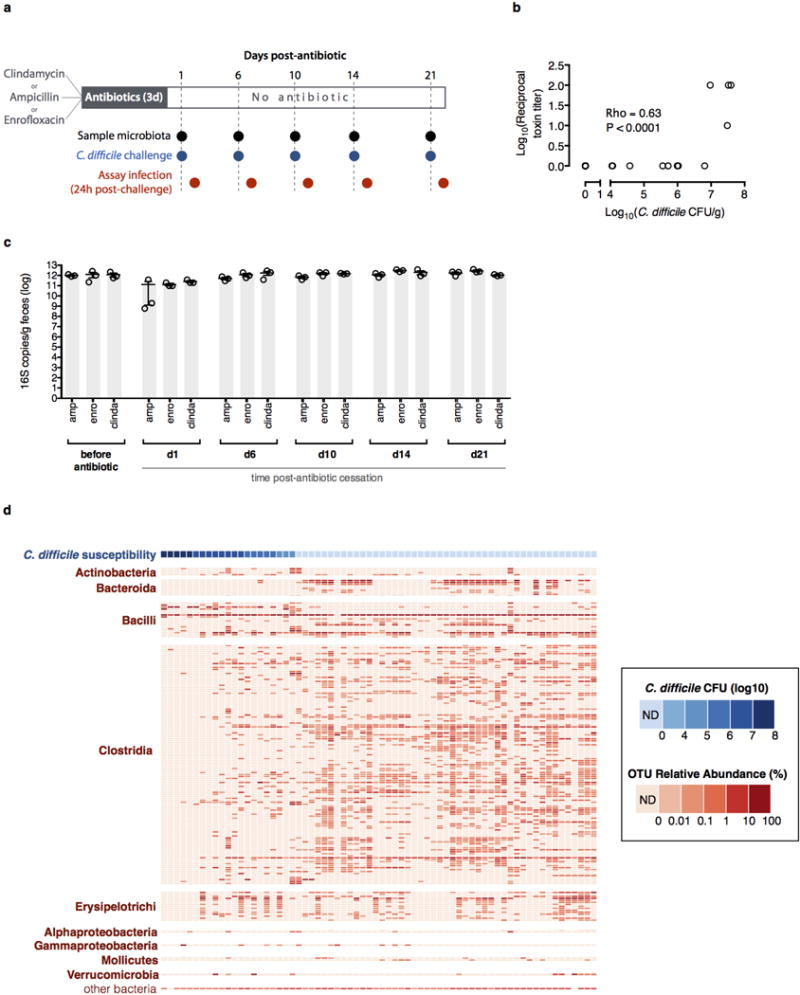
Extended Data Figure 1. Dynamics of intestinal microbiota structure and C. difficile susceptibility following antibiotic exposure.

Strategy for determining C. difficile susceptibility duration post-antibiotic exposure (n=3 separately-housed mouse colonies per antibiotic arm) and relating infection resistance to microbiota structure (a). Intestinal bacterial density of animals before and after antibiotic exposure (b). Results were representative of two independent experiments. Center values (mean), error bars (s.e.m.) (b). Relative abundance of bacterial OTUs (≥97% sequence identity, >0.01% relative abundance) sorted by class (red) and corresponding C. difficile susceptibility (blue) among antibiotic-exposed mice (n=68) allowed to recover for variable time intervals prior to C. difficile infection challenge (c). Results were representative of two independent experiments. ND (not detectable).
