
Extended Data Figure 2. Allo-HSCT patient timelines and C. difficile infection status transitions.
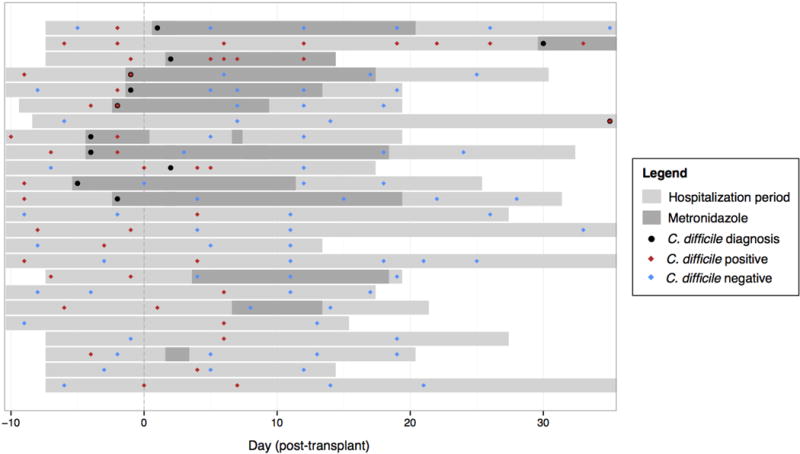
Transitions between C. difficile (tcdB-positive) colonization status in patients receiving allogeneic hematopoietic stem cell transplantation, as measured by C. difficile 16S rRNA abundance during the period of hospitalization (light gray bars). Timepoints when C. difficile colonization was determined to be positive (red diamonds) and negative (blue diamonds), and when C. difficile infection was clinically diagnosed (black dots) and metronidazole was administered (dark gray bars), are displayed relative to the time of transplant per patient.