Fig. 2.
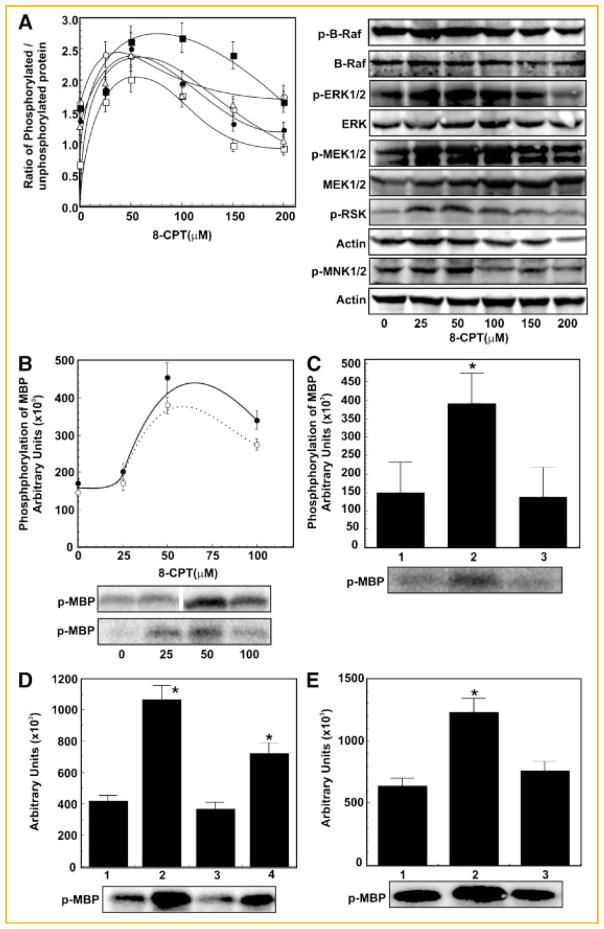
8-CPT induces activation of B-Raf and MAPKs in 1-LN prostate cancer cells. Panel A: Extent of phosphorylation of (●) B-Raf, (○), MEK 1/2 (▲), ERK1/2 (△) RSK, and (■) MNK1/2 as determined by Western blotting of 1-LN cells treatment with varying concentrations of 8-CPT. The changes in phosphorylation are expressed as the ratio of phosphorylated protein/unphosphorylated protein or actin as the mean ± SE from three to four experiments. Representative immunoblots of p-B-Raf, p-MEK1/2, p-ERK1/2, p-RSK and p-MNK1/2, respectively along with the respective protein loading controls are shown on the right of Panel A. Panel B: Phosphorylation of MBP by B-Raf1 (●) or ERK1/2 (○) immunoprecipitates in 1-LN cells treated with varying concentrations of 8-CPT. Activation of B-Raf and ERK1/2 are shown in arbitrary units and are expressed as the mean ± SE from three experiments. A representative autoradiograph of MBP phosphorylated by B-Raf (upper panel) and ERK1/2 (lower panel), immunoprecipitates respectively is shown below the panel. Panel C: Downregulation of MBP phosphorylation in the B-Raf immunoprecipitate of 1-LN cells transfected with Epac dsRNA. The bars are: (1) lipofectamine + buffer; (2) lipofectamine + 8-CPT (50 μM); and (3) lipofectamine + dsRNA (100 nM) then 8-CPT (50 μM). The changes in MBP phosphorylation are shown in arbitrary units as mean ± SE from three experiments. A representative autoradiograph is shown below the bar diagram. Panel D: Down regulation of ERK1/2-induced phosphorylation of MBP by ERK1/2 immunoprecipitates of 1-LN cells transfected as in Panel C. The bars are: (1) lipofectamine + buffer; (2) lipofectamine + 8-CPT (50 μM); (3) lipofectamine + Epac dsRNA (100 nM) + 8 CPT (50 μM); and (4) lipofectamine + scrambled dsRNA (100 nM) + 8-CPT (50 μM). The changes in MBP phosphorylation are shown in arbitrary units expressed as mean ± SE from three experiments. A representative autoradiograph is shown below the bar diagram. Panel E: Inhibition of ERK1/2-induced increase in MBP phosphorylation by ERK1/2 inhibitor PD98059. The bars are: (1) buffer; (2) 8-CPT (50 μM); and (3) PD98059 (50 μM/90 min) then 8-CPT (50 μM). Phosphorylation of MBP is shown in arbitrary units as the mean ± SE from three experiments. A representative autoradiograph is shown below the bar diagram. *Values significantly different from the buffer controls, EPAC dsRNA transfected, or inhibitor-treated cells as compared to 8-CPT- or scrambled dsRNA-treated cells at the 5% level.

