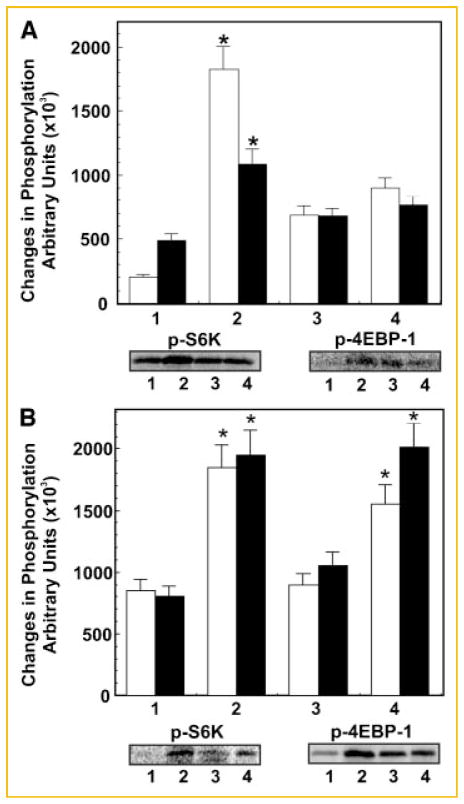
Fig. 5.
Effect of PI 3-kinase or mTOR inhibitor on 8-CPT-induced cellular effects. Panel A: Inhibition of 8-CPT induced activation of S6K (□) and 4EBP1 (■) by inhibitors of PI 3-kinase and mTOR as measured by the phosphorylation of S6K peptide and PHAS protein by immunoprecipitates of mTOR respectively. The sets of bars are: (1) buffer; (2) CPT; (3) LY294002 (20 μM/20 min) then 8-CPT; and (4) rapamycin (100 nM/15 min) then 8-CPT. Representative autoradiographs of phosphorylated S6K peptide and PHAS protein is shown below the bar diagram. Panel B: Downregulation of 8-CPT-induced activation of S6K (□) and 4EBP1 (■) by transfecting the 1-LN cells with Epac dsRNA as measured by the phosphorylation of S6K peptide and PHAS protein in mTOR immunoprecipitates, respectively. The sets of bars are: (1) lipofecta-mine + buffer; (2) lipofectamine + 8-CPT; (3) lipofectamine + Epac dsRNA (100 nM) then 8-CPT; and (4) scrambled dsRNA (100 μM) then 8-CPT. A representative autoradiograph of phosphorylated S6K peptide and PHAS protein is shown below bar diagram.

