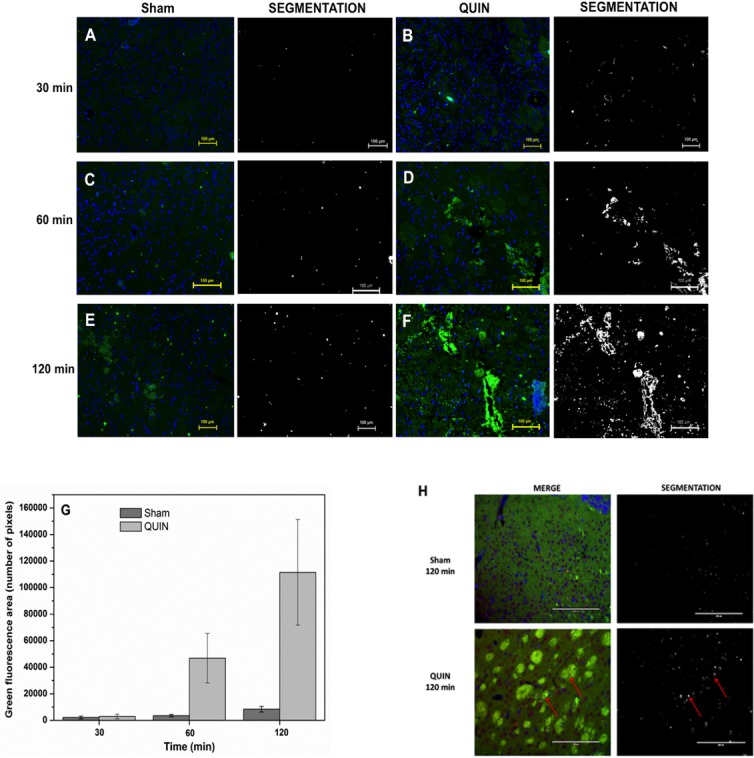
Fig 5. Fluorescent labeling of RAGE.

Immunofluorescent localization of intracellular RAGE in the striatum of Sham (A, C and E)- and QUIN (B, D and F)-treated rats at different (30, 60 and 120 min) post-lesion times. RAGE is marked in green and cell nuclei (DAPI staining) in blue. Prominent immunofluorescence against RAGE was detected in D and F. In G, the density of immunopositive cells (mean green area ± SD) is graphically represented. In H, merge images showing the co-staining of nuclei (DAPI in blue and violet), neuronal cells (NeuN in red and violet) and RAGE (in green) in Sham and QUIN-lesioned striata at 120 min after the lesion. Arrows indicate triple co-localization. For all images, additional columns showing the marking process for quantification of the fluorescent labeling by the segmentation method are shown sidewise the treatment columns.
