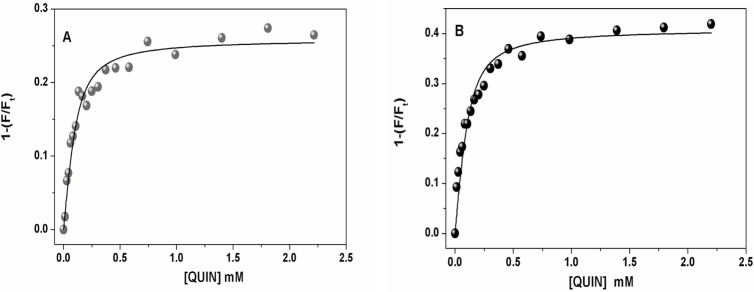
Fig 7. Titrations of VC1 with QUIN, monitored by fluorescence detection.

The initial protein concentration was 0.1 μM. Excitation was 280 nm and fluorescence emission was measured at 320 nm. Circles represent the fraction of total VC1 fluorescence (Ft) that is quenched by adding QUIN. Both titrations were done at 25°C in 20 mM Tris-base plus 133 mM NaCl at pH 7.4 (A) and in 20 mM glicine plus 133 mM NaCl at pH 9.0 (B). Data points were fitted to Equation (1) using nonlinear regression (solid line).
