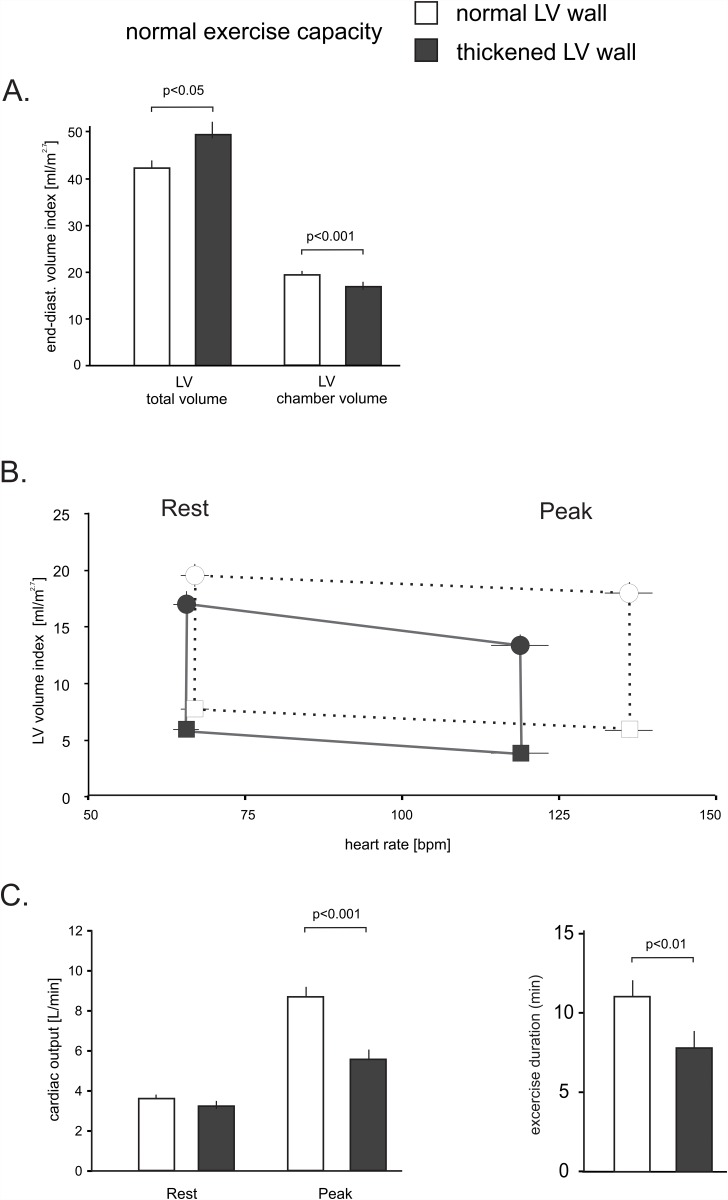
Fig 3. LV volume and heart rate relationship in patients with a completed stress test and normal or increased LV wall thickness.
Panel A demonstrates the differences in the resting total LV size and LV chamber volume. Panel B demonstrates the relationship of heart rate and indexed LV volume at rest and with peak exercise. The exercise-dependent diastolic LV volume loss was significantly more pronounced in patients with an increased LV wall thickness. Circles: end-diastolic volumes, squares: peak systolic volumes. The vertical lines equal the stroke volume index. Panel C depicts cardiac output and exercise duration at rest and with exercise in both groups. Error bars ±SE.

