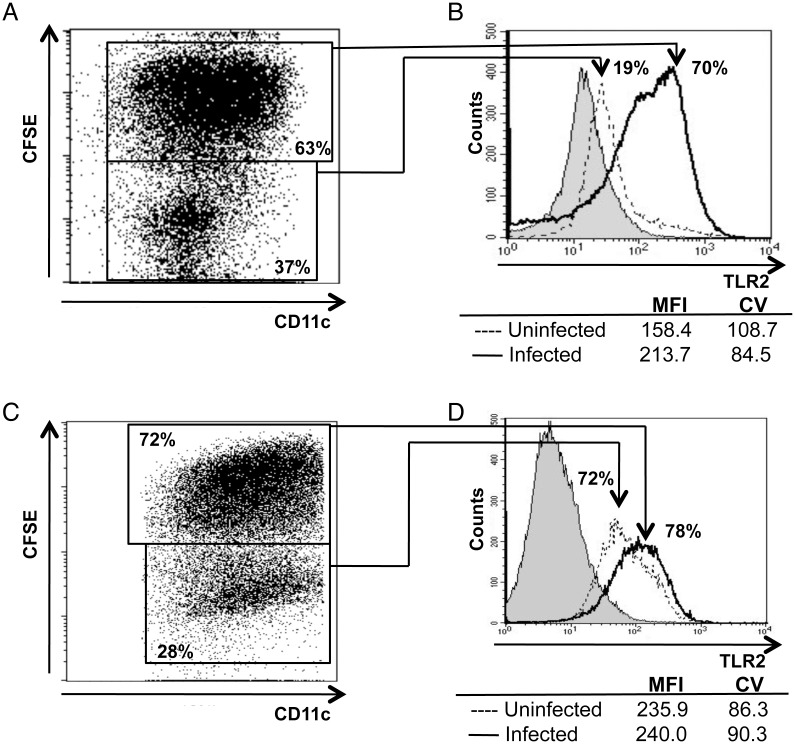
Fig 2. TLR2 expression is only upregulated in infected BMDDCs from C57BL/6 mice.
Flow cytometry plots of bone marrow-derived CD11c+ DCs from (A) C57BL/6 and (C) BALB/c mice infected with CFSE-labeled L. major at a cell/parasite ratio of 1:5 for 18 h. Numbers indicate relative frequencies of infected (double positive) and uninfected (single positive) cells. Surface TLR2 expression in the infected, double positive (solid line) and in the uninfected, single positive (dotted line) populations from (B) C57BL/6 and (D) BALB/c mice. An unstained sample is included as a grey histogram. MFI and CV values are also shown. Data are representative of n = 3 experiments with similar results.

