


Figure 2.
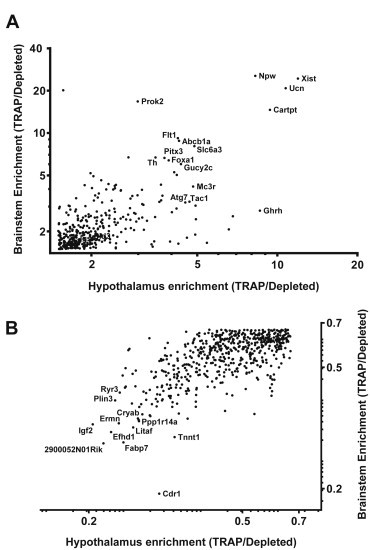
A subset of proteins are enriched or de-enriched in both hypothalamic and brainstem LepRb neurons. (A) Transcripts enriched (expression in TRAP/Depleted >1.5) in both the hypothalamic and the brainstem TRAP derived fraction were plotted against each other to reveal the transcripts mostly highly enriched in both brain areas. (B) Transcripts de-enriched in the TRAP-derived fraction relative to background (TRAP/Depleted <0.66) for both areas were also identified and plotted. Poorly expressed transcripts (<1 fragments per kilobase of exon per millions reads mapped (FPKM)) in the TRAP-derived fraction (A, 88 of 437 genes) or TRAP-depleted fraction (B, 233 of 739 gene) of either brain area were excluded from the graph. All genes shown were differentially expressed between the TRAP and depleted fractions (p < 0.05) as determined by CuffDiff analysis.