
Figure 4.
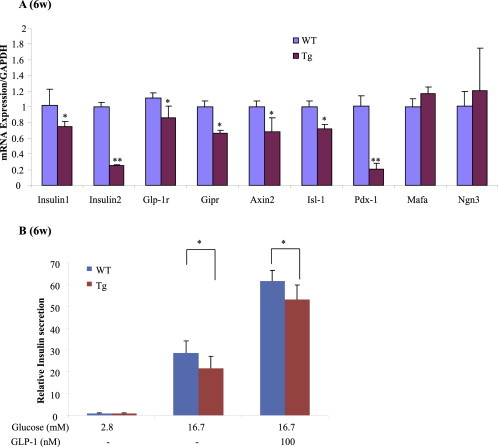
βTCFDN mouse islets show reduced β-cell specific gene expression and attenuated response to GLP-1 treatment. A) qPCR assessment for β-cell specific gene expression. n = 3 for both βTCFDN and control ins2-rtTA mice. B) Assessment of insulin secretion by GLP-1 treatment in isolated βTCFDN mouse islets. n = 3 for both βTCFDN and control ins2-rtTA mice.