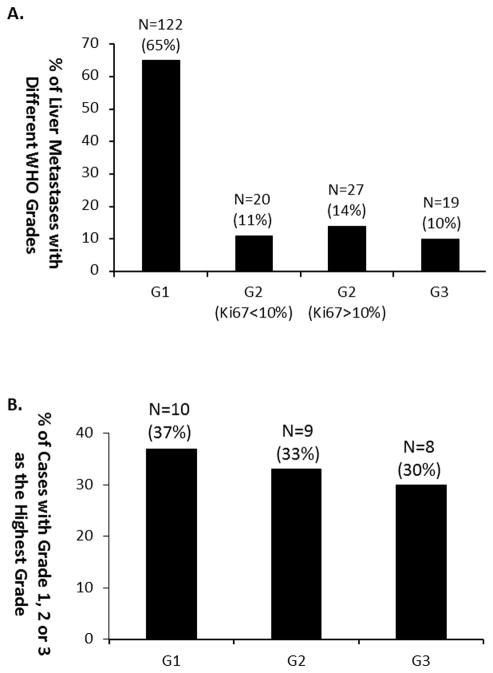
Figure 1.
Distribution of small intestine NET liver metastases of different WHO grades. A. Distribution of grade 1, grade 2 with Ki67≤10%, grade 2 with Ki67>10%, and grade 3 tumors among 129 resected liver metastases; B: Distribution of cases with grade 1, grade 2, and grade 3 as the highest grade among 17 patients. G=grade.

