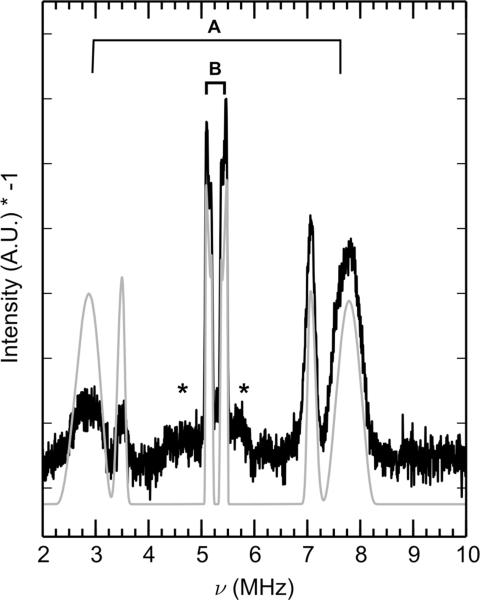
Figure 4.
Mims ENDOR spectrum (black) of Mn(II)- and Ca(II)-bound 15N-CP-Ser collected at τ = 500 ns and simulation (gray). A corresponds to the proximal nitrogen of the imidazole ring. B corresponds to the distal nitrogen of the imidazole ring. The asterisk (*) indicates 15N ENDOR transitions coupled to the ms= ±1/2 ↔ ms = ±3/2 EPR transitions. Simulation of ms = ±1/2 for the two classes of nitrogen atoms (gray) were obtained using the parameters listed in Table 3. Spectra at additional τ values are presented in Figure S6. Spectrometer settings: νmw = 34.1 GHz, B0 = 1222.5 mT, 8 ns π/2, temperature = 10 K. Sample conditions: 200 μM 15N-CP-Ser, 180 μM Mn(II), 2.0 mM Ca(II) at pH 7.5 (75 mM HEPES, 100 mM NaCl, 20% (v/v) PEG 200).

