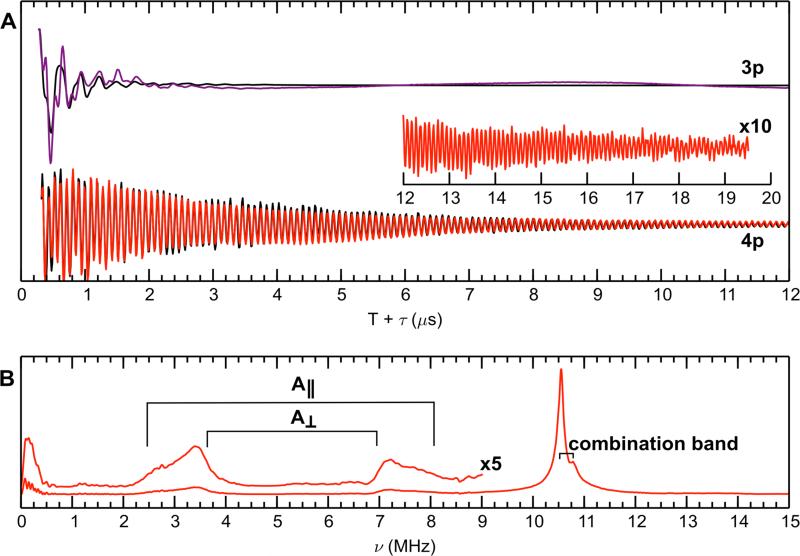
Figure 5.
3-pulse (purple line) and 4-pulse (red line) ESEEM of Mn(II)- and Ca(II)-bound 15N-labeled CP-Ser at 34.1 GHz. The top panel (A) is the time domain. The bottom panel (B) is the Fourier transform of the 4-pulse ESEEM time domain. The black traces represent simulations of each spectrum, and the parameters are listed in Table 3. Spectrometer settings: νmw = 34.1 GHz, π/2 = 8 ns, τ = 200 ns, T0 = 120 ns, temperature = 10 K, shot repetition time = 1500 μs, B0 = 1223.7 mT. Sample conditions: 200 μM 15N-CP-Ser, 180 μM Mn(II), 2.0 mM Ca(II) at pH 7.5 (75 mM HEPES, 100 mM NaCl, 20% (v/v) PEG 200).

