Figure 1.
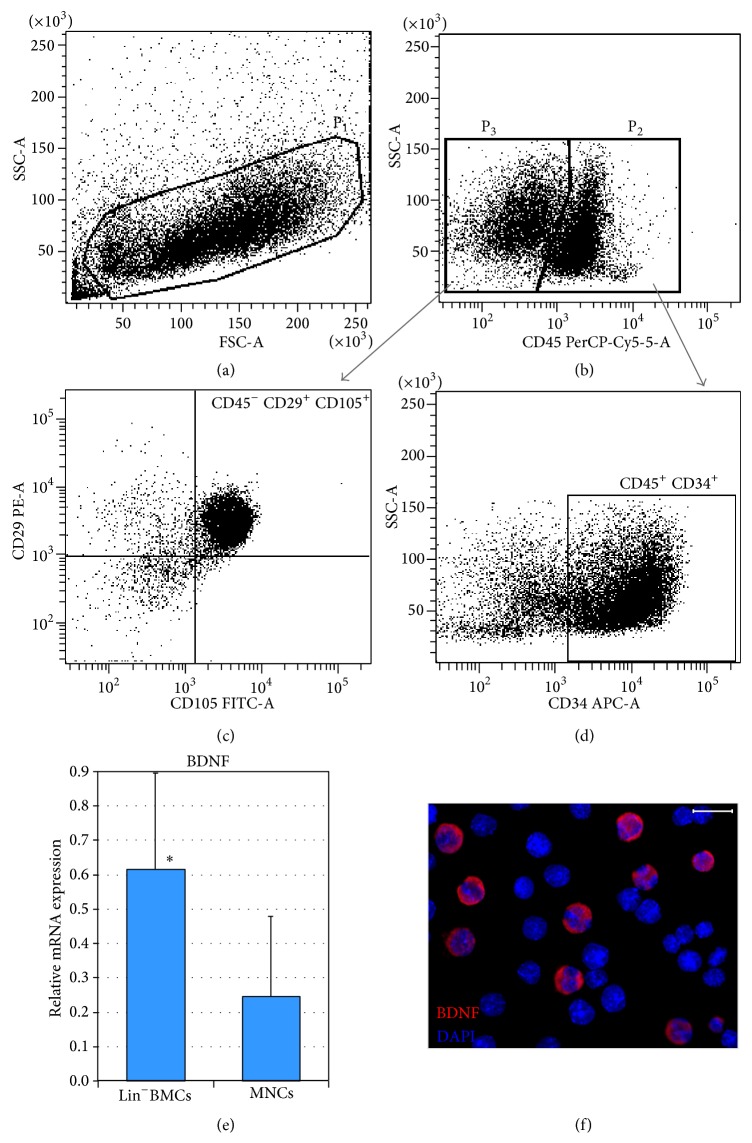
Quantification of the hematopoietic and mesenchymal origin of a BM-derived Lin− cell population by flow cytometry. Lin−BMC distribution based on FSC (Forward Scatter) and SSC (Side Scatter) parameters that describe their size and granularity, respectively (a). The cells enclosed in region P1 were further subdivided into hematopoietic (region P2) or nonhematopoietic (region P3) cell populations based on their CD45 antigen expression (b). CD45− BMCs were additionally analyzed based on their CD29 and CD105 antigen expression to determine their mesenchymal origin (c). Similarly, CD45+ BMCs were analyzed according to their CD34 antigen expression to exclude mature hematopoietic cells and to determine the number of hematopoietic stem/progenitor cells (d). Expression of mRNA for BDNF in isolated Lin−BMCs and BM-derived mononuclear cells (e). Immunocytofluorescence image of Lin−BMCs depicts the expression of BDNF protein (red). Nuclei are visualized with DAPI staining (blue) (f). Scale bar = 20 μm. * P < 0.05.

