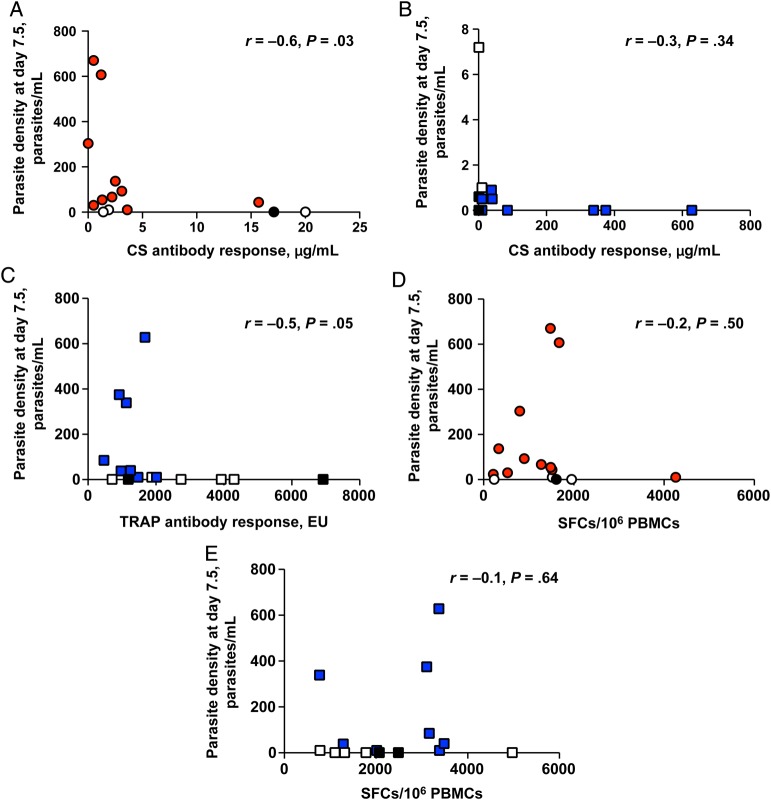
Figure 7.
Associations between immunological outcomes and vaccine efficacy. Correlation between parasite density at day 7.5, measured by quantitative polymerase chain reaction (qPCR), and levels of anti–circumsporozoite protein (CS) immunoglobulin G (IgG) antibody in group 1 (CS; Spearman r = −0.6; P = .03; A) and group 2 (ME-TRAP; Spearman r = −.3; P = .34; B). C, Correlation between parasite density at day 7.5, measured by qPCR, and anti-TRAP IgG antibody responses in group 2 (ME-TRAP; Spearman r = −0.5; P = .05). D, Correlation between interferon γ (IFN-γ)–secreting T-cell frequency to CS measured by enzyme-linked immunosorbent spot (ELISPOT) parasite density at day 7.5 (parasite/mL measured by qPCR) in group 1 (CS; Spearman r = −0.2; P = .50. E, Correlation between IFN-γ–secreting T-cell frequency to ME-TRAP measured by ELISPOT and parasite density at day 7.5 (parasite/mL measured by qPCR) in group 2 (ME-TRAP; Spearman r = 0.1; P = .6). Abbreviations: Black filled points, sterilely protected vaccinees; EU, enzyme-linked immunosorbent assay units; group 1, ChAd63-MVA CS; group 2, ChAd63-MVA ME-TRAP; ME-TRAP, multiple epitope–thrombospondin-related adhesion protein; PBMC, peripheral blood mononuclear cell; SFC, spot-forming cell; unfilled points, vaccinees demonstrating delay to start of antimalarial therapy in comparison to unvaccinated control volunteers.

