Figure 1.

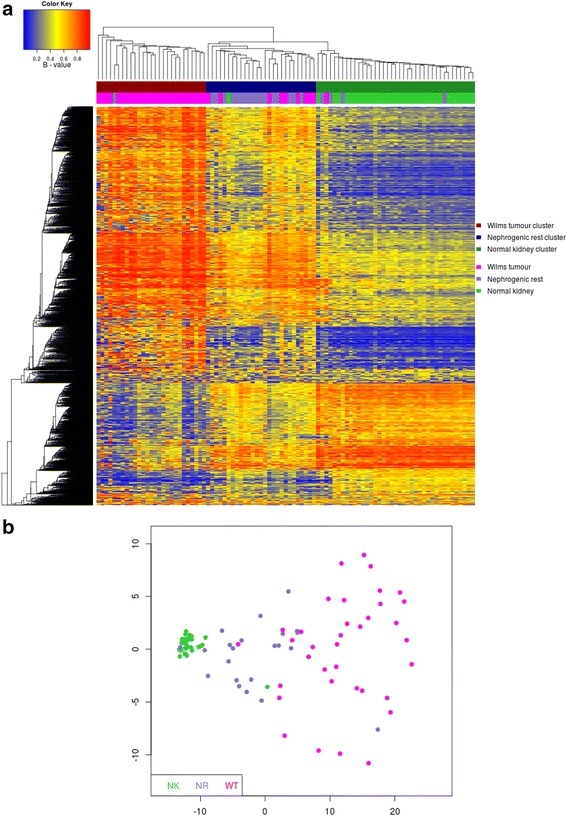
Unsupervised analysis of methylation values in normal kidney (NK), nephrogenic rests (NR) and Wilms tumour (WT). (a) Unsupervised consensus clustering of the top 1% most variable positions across the full dataset as determined based on interquartile range. Three clusters were formed which predominantly separated tissue types. The 'Wilms tumour cluster' (dark red) is WT-predominant with 26 WT (pink) and 1 NR (blue) sample, which is separated from the 'nephrogenic rest cluster' (navy) with 17 NR, 9 WT and 1 NK (green) sample and the 'normal kidney cluster' (dark green) with 34 NK, 4 NR and 1 WT sample. As the nephrogenic rest cluster contains several WT samples, some tumours may not be as epigenetically distinct from their precursor lesions as suggested by their morphology. (b) Multidimensional scaling of the top 1% most variable positions showed greater variability across the NR and WT datasets compared with NK.
