Figure 7.
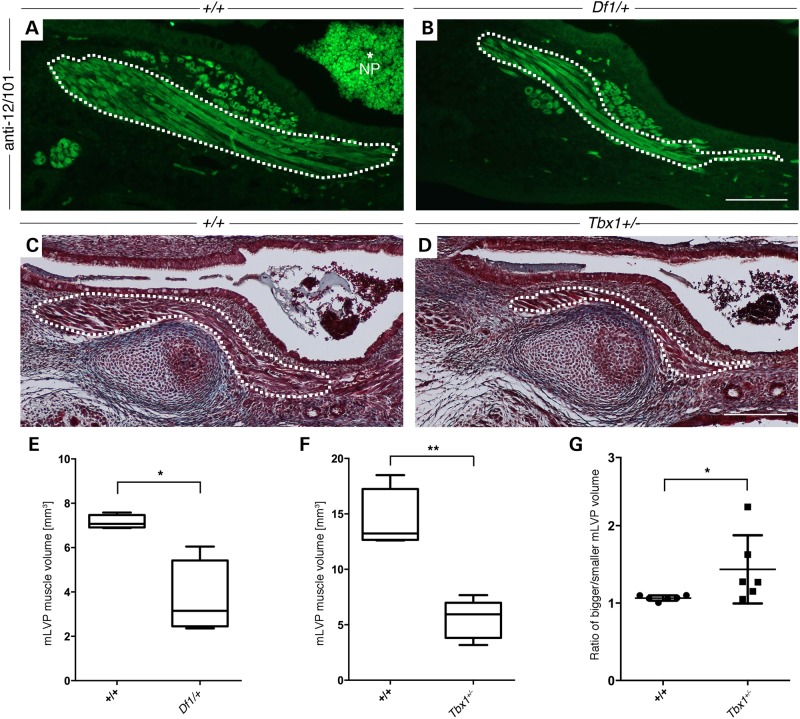
Neonatal Df1/+ and Tbx1+/− mice have hypoplastic mLVP. (A and C) WT; (B) Df1/+; (D) Tbx1+/−. The mLVP is outlined in white. (A and B) Immunohistochemistry against the skeletal muscle marker 12/101 stains the muscle fascicles of the mLVP in newborn control mice (A) and in Df1/+ littermates, showing a reduced muscle fascicle number. (D) A reduced muscle size can also be found in Masson's Trichrome-stained Tbx1+/− mice compared with (C) control littermates. (E and F) Measurements of the mLVP show that muscle masses in neonatal Df1/+ (n = 4, E) and Tbx1+/− (n = 6, F) animals are significantly smaller compared with their control littermates (WT = 4 and WT = 6, respectively; P = 0.0286 and 0.0022, respectively). (G) Scatter plot graph displaying the ratio of the two mLVP within each animal, demonstrating a significant size difference between these muscles in neonatal Tbx1+/− mice (WT = 6, Tbx1+/− = 6; P = 0.0411). Statistical analysis was performed using non-parametric Mann–Whitney test. Neonatal ages were ranging between E18.5 and P1. Note accumulated blood in the nasopharynx (NP; A, asterisk) occurred post-mortem. Scale bars: A and B, 100 µm; C and D, 200 µm.

