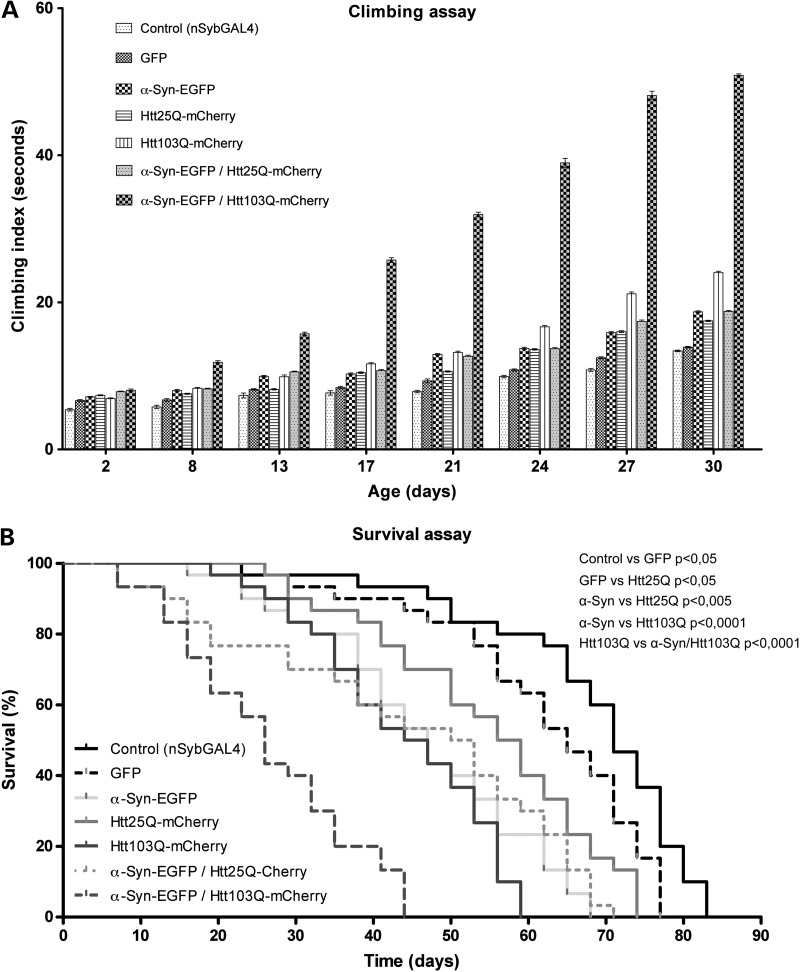
Figure 6.
Co-expression of Htt103Q-mCherry and α-syn-EGFP in the nervous system causes severe motor dysfunction and a decrease in life span. (A) Flies co-expressing Htt103Q-mCherry and α-syn-EGFP under the control of nSyb-GAL4 show a strong impairment of the motor abilities compared with the rest of the genotypes tested. The Y-axis represents the time (in seconds), it took for five males to climb 15 cm (mean ± SEM). Statistically significant values, comparing each of genotypes, were calculated by doing two-way ANOVA with Bonferroni post-test. With very few exceptions, all the differences detected between the genotypes tested in this assay were statistically significant with a P < 0.001 (except the difference between the genotypes Htt25Q-mCherry and α-Syn-EGFP/Htt25Q-mCherry which is significant for a P < 0.01). The differences not statistically significant (P > 0.05) were GFP versus Htt25Q-mCherry at day 13; α-Syn-EGFP versus Htt103Q-mCherry at day 13; α-Syn-EGFP versus α-Syn-EGFP/Htt25Q-mCherry at days 24 and 30; Htt103Q-mCherry versus α-Syn-EGFP/Htt25Q-mCherry at day 8. (B) Flies co-expressing Htt103Q-mCherry and α-syn-EGFP under the control of nSyb-GAL4 have a life span significantly shorter in comparison with the rest of the genotypes tested. Values on the Y-axis represent the percentage of flies alive at each time point analyzed. The maximum survival (in days) is indicated for each genotype (the mean values indicate the number of days it took for half of the flies to die): control (nSyb-GAL4) 83 (mean = 70), GFP (nSyb-GAL4, UAS-GFP) 77 (mean = 64), α-syn-EGFP (nSyb-GAL4, UAS-α-syn-EGFP) 68 (mean = 45), Htt25Q-mCherry (nSyb-GAL4, UAS- Htt25Q-mCherry) 74 (mean = 56), Htt103Q-mCherry (nSyb-GAL4, UAS-Htt103Q-mCherry) 59 (mean = 44), α-syn-EGFP/Htt25Q-mCherry (nSyb-GAL4, UAS-α-syn-EGFP/UAS-Htt25Q-mCherry) 71 (mean = 50) and α-syn-EGFP/Htt103Q-mCherry (nSyb-GAL4, UAS-α-syn-EGFP/UAS-Htt103Q-mCherry) 44 (mean = 25). Statistical significance is indicated in the graph (log-rank, Mantel–Cox test).

