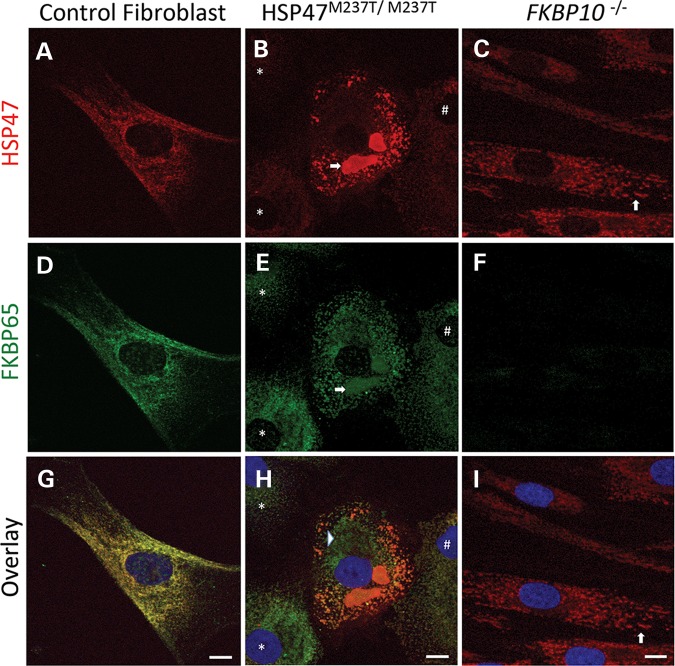
Figure 4.
HSP47M237T M237T and FKBP10−/− cells show protein accumulation in vesicles. Immunofluorescence against HSP47 (red) and FKBP65 (green) of control cells (A, D, and G), HSP47M237T/M237T (B, E and H) and FKBP65 (C, F and I) show co-localization of these proteins and their presence in massive vesicles in HSP47-mutant cells (arrows in B and E) and ER dilatation in FKBP10−/− (arrows in C and I). Arrow, asterisk and hash in B, E and H show variability of HSP47 signal in HSP47M237T M237T cells. Asterisk shows almost absence of HSP47 protein and hash shows a cell with low HSP47 expression. Bars represent 10 µm.

