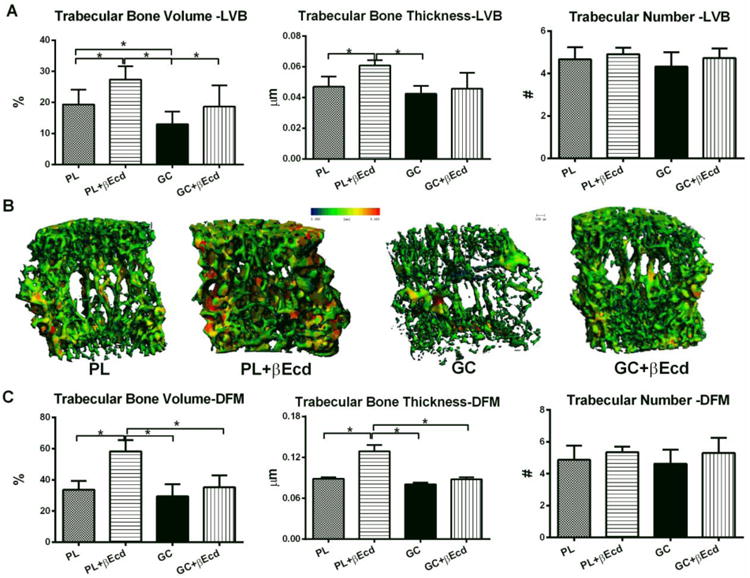
Figure 1.

Effects of GC and βEcd treatments on the vertebral and femoral trabecular bone microarchitectures, assessed by microCT. Two-month-old mice were treated with βEcd, GC or concurrent treatment of GC + βEcd for 21 days. (A) Lumbar vertebral trabecular bone (LVB) structure measured by micro-CT. (B) Representative trabecular thickness maps were obtained from the LVB by micro-CT where the trabecular thickness is color coded: with blue-green colors indicate thinner trabeculae whereas yellow-red colors fare used for thicker trabeculae. (C) Distal femoral trabecular bone (DFM) structure as measured by microCT. *: p<0.05 between indicated groups.
