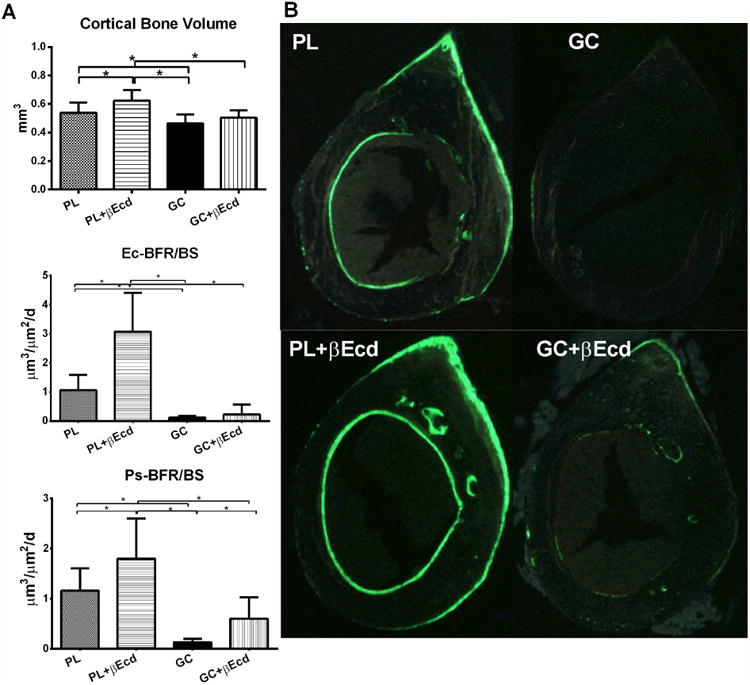
Figure 3.

Effect of GC and βEcd treatments on cortical bone structure and surface-based bone turnover, assessed by microCT and bone histomorphometry. (A) Cortical bone volume and bone formation were measured at the mid-shaft of the femur. (B) Representative cross-sectional cortical bone sections from the mid-shaft of the femurs. *: p<0.05 between indicated treatment groups.
