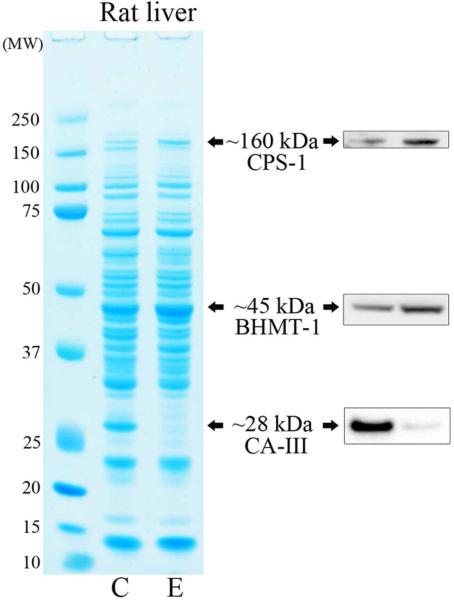
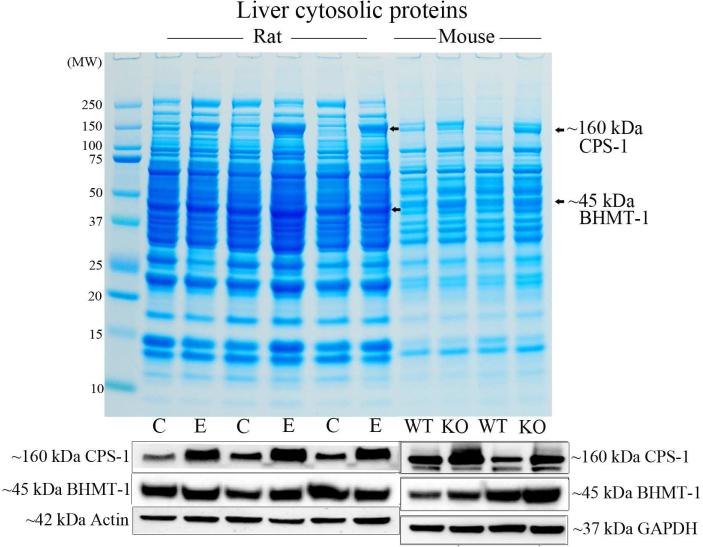
Figure 4. Comparison of the liver proteome of ethanol-fed rats and PIMT KO mice.
(A) Liver proteome from rats fed a control (C) or ethanol (E) diet for 4 weeks were resolved by 1D PAGE and stained with colloidal Coomassie. Elevated CPS-1 and BHMT-1, and reduced CA-III protein levels were visualised by Western blotting. (B) Liver proteome from rats fed a control (C) or ethanol (E) diet for 8 weeks were compared with the proteome of PIMT wild-type (WT) and knockout (KO) mice (upper panel). CPS-1 and BHMT-1 protein levels were visualised by Western blotting (lower panels).


