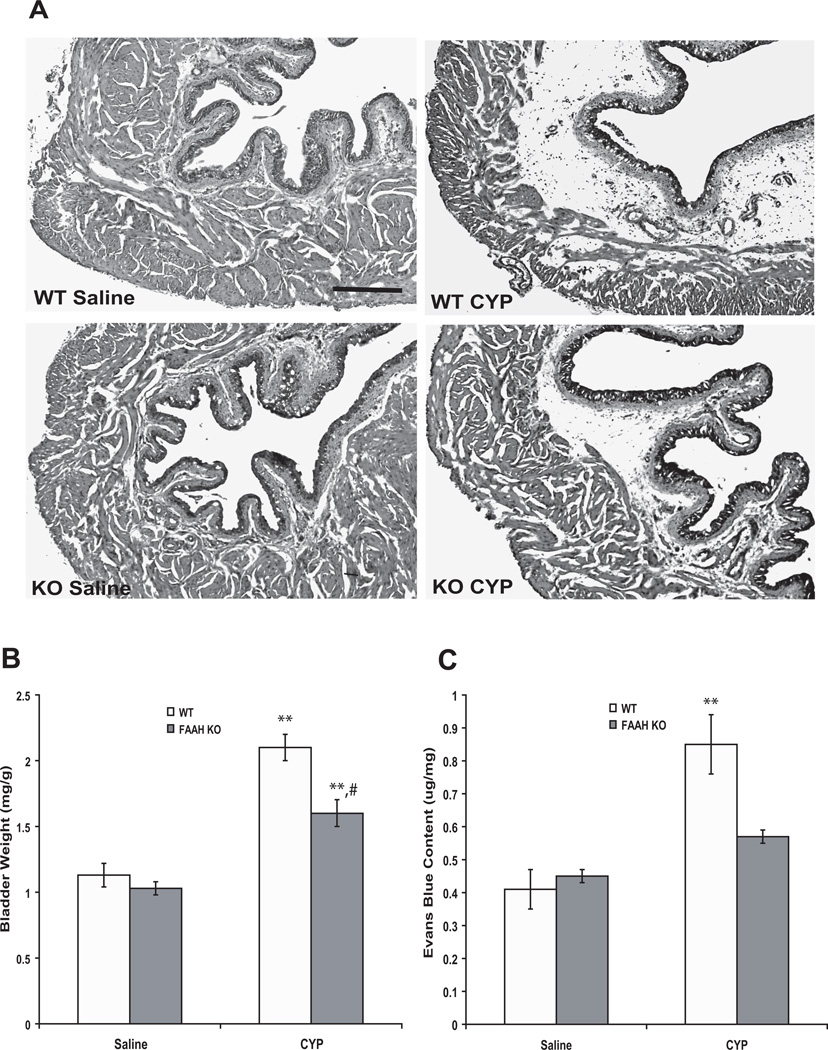
Figure 1.
Representative images of bladders from mice of both genotypes treated with saline or CYP (A). CYP (24 hours) induced cystitis characterized primarily by edema in the submucosal region (A). Scale bar indicates 100 µm. Also, CYP increased bladder weight (B, two way ANOVA results: Finteraction = 4.3, p < 0.05; Fgenotype = 63.3, p < 0.0001; Ftreatment = 9.6, p < 0.01) and plasma extravasation (C, two way ANOVA results: Finteraction = 14.2, p < 0.05; Fgenotype = 43.3, p < 0.0001; Ftreatment = 8, p < 0.05). Mean ± S.E.M. n = 5–8 in each group. **: p < 0.01 vs saline-treated group. #: p < 0.05 vs CYP-treated WT mice.

