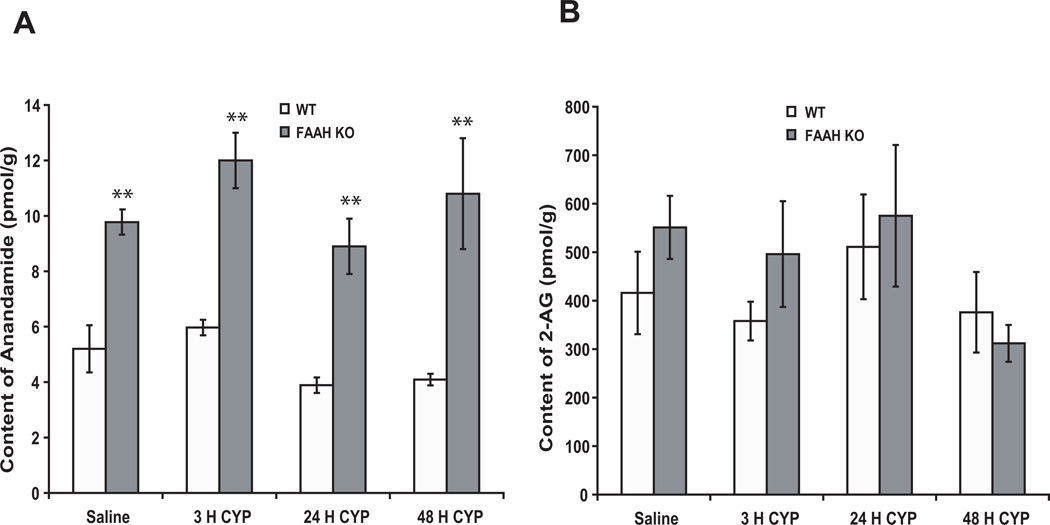
Figure 2.
The concentrations of AEA (A) were significantly greater in bladders of KO as compared to WT mice (two way ANOVA results: Finteraction = 1.4, p = 0.7; Fgenotype = 67.6, p < 0.0001; Ftreatment = 7.3, p = 0.09), and treatment with CYP did not significantly alter AEA content in bladders of either WT or KO mice. Bladder 2-AG content was similar in both WT and FAAH KO mice, and treatment with CYP did not alter 2-AG content in bladders (B). Mean ± S.E.M. n = 4 in each group. **: p < 0.01 vs WT mice.

