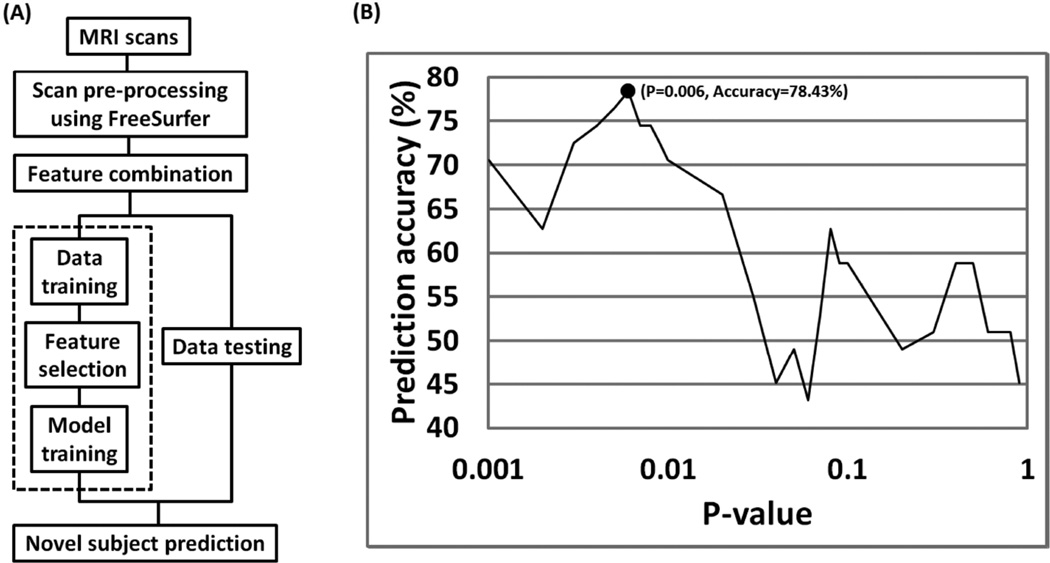
Figure 1.
Flow diagram illustrating SVM model training (using 2nd order polynomial kernel), feature subset selection and model testing process. A) Multiple neuromorphometric measurements were extracted using Freesurfer and combined through concatenation. B) Relevant features were identified using a univariate t-test filter on training data only using a nested leave-one-out cross-validation process. In a single feature selection iteration (dashed line in Figure 1a) – the model selected most optimal t-test p-value = 0.006) as shown in Figure 1b.

