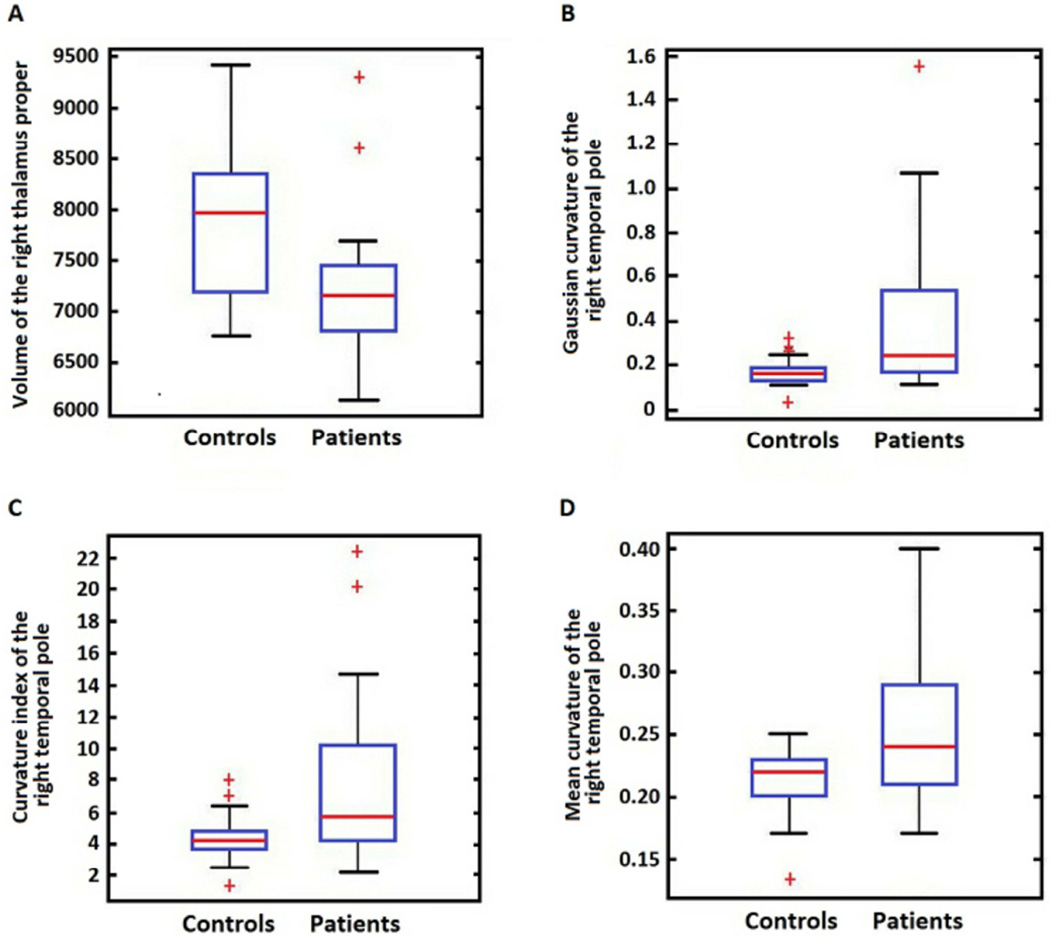
Figure 4.
A) Box plot showing significantly smaller right thalamus proper in PUD patients (two group independent sample t-test p=0.0005. B) Box plot showing significantly higher Gaussian curvature in PUD patients (two group independent sample t-test p=0.0026). C) Box plot showing significantly higher mean curvature (two group independent sample t-test p=0.005) in PUD patients D) Box plot showing significantly higher intrinsic curvature index in PUD patients (two group independent sample t-test p=0.0022).

