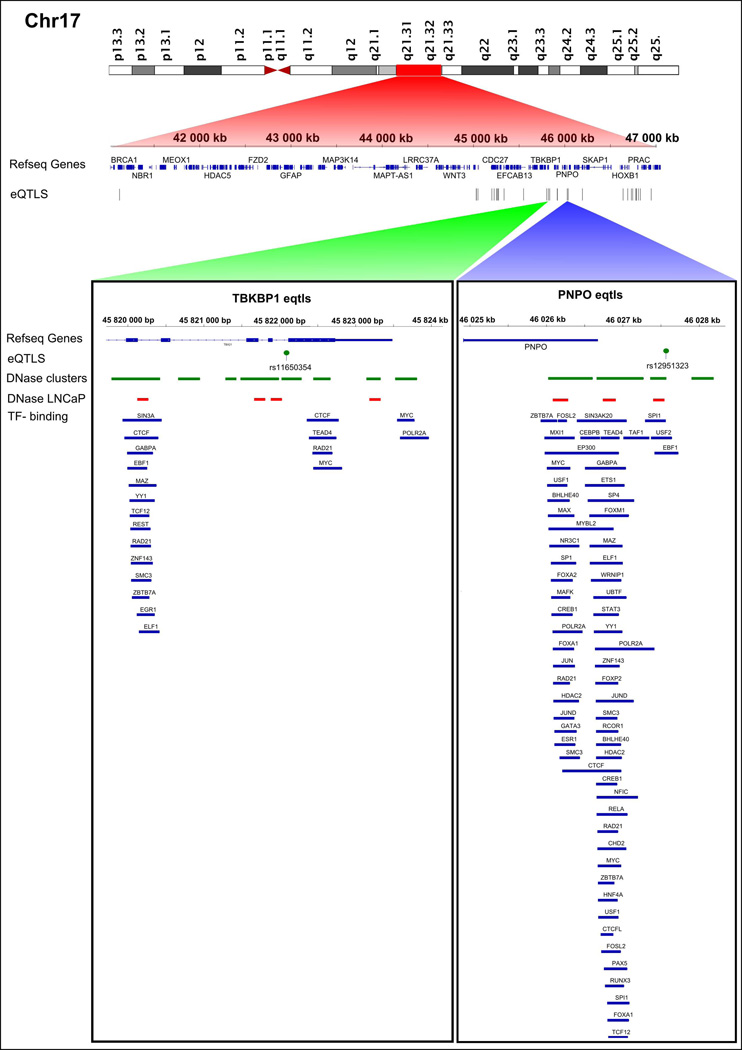
Figure 3. Cis-eQTLs targeting differentially expressed genes on chromosome 17.
All statistically significant eQTLs are indicated with a track of black bars. Selected eQTLs, rs11650354 (targeting TBKBP1) and rs12951323 (targeting PNPO) are illustrated in more detail. DNaseI hypersensitive sites from the DNase cluster and LNCaP datasets are indicated with green and red rectangles, respectively. Blue rectangles denote TF binding sites.

