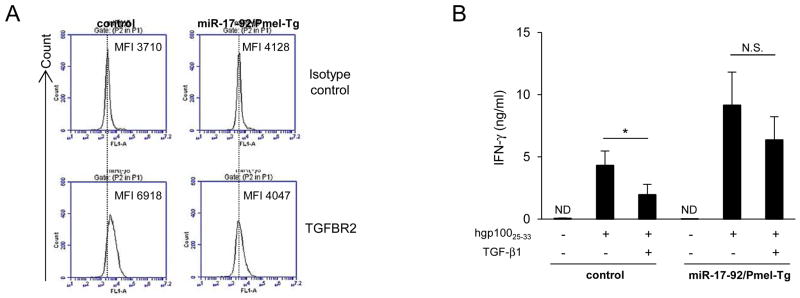
Figure 3. miR-17-92 expression in CD8+ T-cells provided resistance to suppressive effect of TGF-β1.

CD8+ T-cells were isolated from control and miR-17-92/Pmel-Tg mice. (A) Cell surface expression level of TGFBR2 was evaluated by flow cytometry. Flow data are representative of two independent experiments. (B) CD8+ T-cells were cultured with hgp10025-33 (0.125 μg/ml) and feeder cells in the presence or absence of TGF-β1 (4 ng/ml) for 46 hours. IFN-γ secretion was determined by ELISA. Bars and error bars indicate the mean and SD, respectively, from three independent experiments. (ND, not detected; N.S., no significant; *P < 0.05, t-test)
