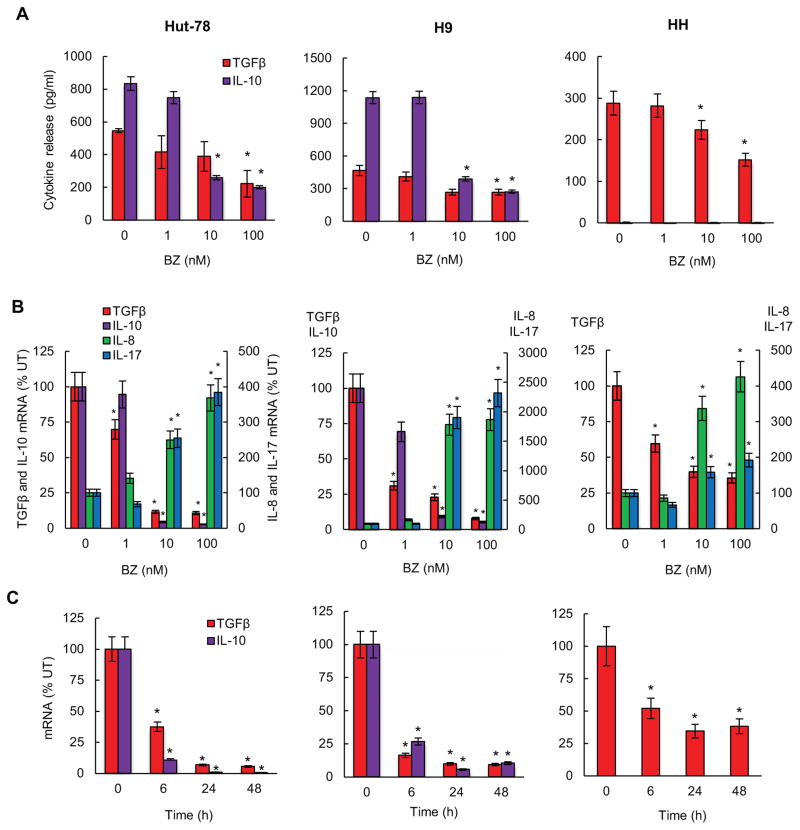
Figure 1. Proteasome inhibition suppresses TGFβ1 and IL-10 expression in CTCL cells.
(A) ELISA assay of TGFβ1 and IL-10 release measured in cell culture supernatants of Hut-78 (left panels), H9 (middle panels), and HH (right panels) cells incubated 24 hours with increasing BZ concentrations. (B) Real time RT-PCR analysis of TGFβ1, IL-10, IL-8 and IL-17 mRNA levels in Hut-78, H9, and HH cells treated 24 hours with increasing BZ concentrations. (C) Real time RT-PCR of TGFβ1 and IL-10 mRNA levels in Hut-78, H9, and HH cells treated 0, 6, 24, and 48 hours with 10 nM BZ. The values in Figs. 1A-C represent the mean +/−SE of four experiments. Asterisks denote a statistically significant (p<0.05) change compared to control untreated (UT) cells.

