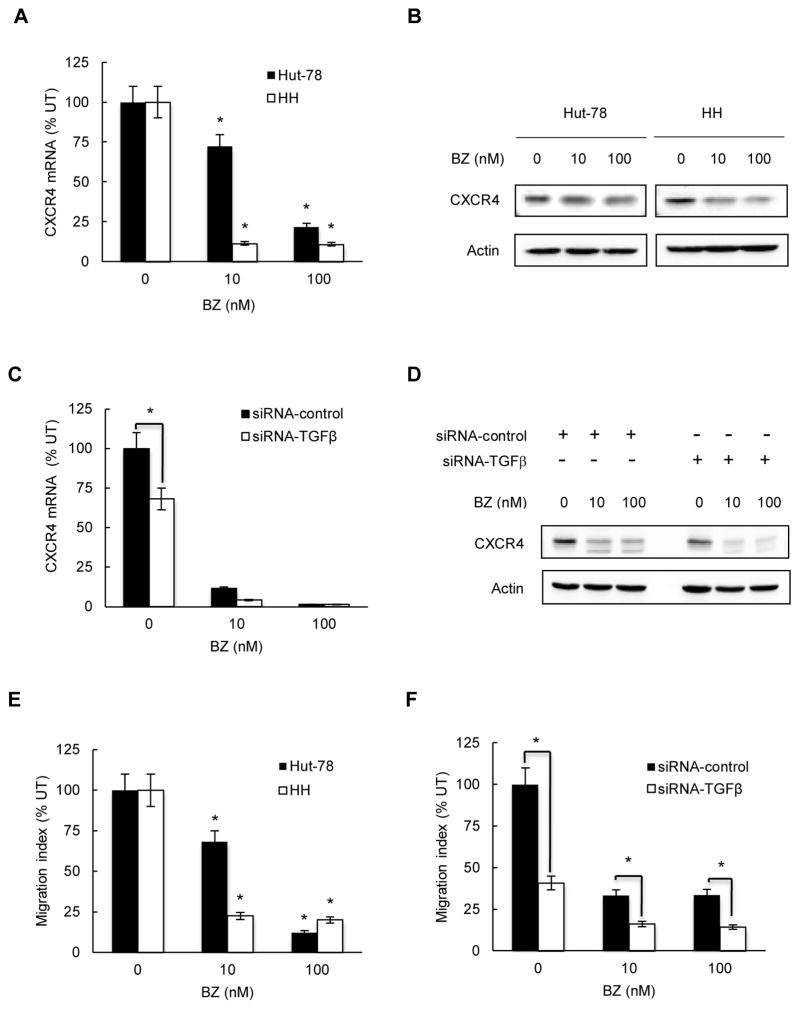
Figure 7. BZ inhibits CXCR4 expression and migration of CTCL cells.
(A) Real time RT-PCR analysis of CXCR4 mRNA levels in Hut-78 (full columns) and HH (empty columns) cells treated 24 hours with 0, 10 and 100 nM BZ. The values represent the mean +/−SE of four experiments. Asterisks denote a statistically significant (p<0.05) inhibition compared to untreated cells. (B) Western analysis of CXCR4 protein levels in WCE prepared from Hut-78 and HH cells treated 24 hours with 0, 10 and 100 nM BZ. Equal protein loading was confirmed by re-probing the membranes with anti-actin antibody. (C) Real time RT-PCR of CXCR4 mRNA levels in HH cells transfected with control (full columns) or TGFβ1 specific (empty columns) siRNA and treated 24 hours with 0, 10 and 100 nM BZ. The values represent the mean +/−SE of four experiments. The asterisk denotes a statistically significant change compared to cells transfected with control siRNA. (D) Western analysis of WCE prepared from HH cells transfected with control or TGFβ1 siRNA, treated 24 hours with 0, 10 and 100 nM BZ, and analyzed by using CXCR4 and actin antibodies. (E) Migration assay of Hut-78 and HH cells incubated 6 hours with 0, 10 and 100 nM BZ. Results are expressed as migration index that represents the ratio between the number of cells that migrated in the presence of BZ and the number of migrated untreated cells. The values represent the mean +/−SE of four experiments. Asterisks denote a statistically significant inhibition compared to untreated cells. (F) Migration assay of HH cells transfected with control (full columns) or TGFβ1 specific (empty columns) siRNA and treated 6 hours with 0, 10 and 100 nM BZ. Results are expressed as migration index representing the ratio between the number of cells migrating in the presence of BZ and the number of untreated migrating cells; the values represent the mean +/−SE of four experiments. Asterisks denote a statistically significant change compared to cells transfected with control siRNA.

