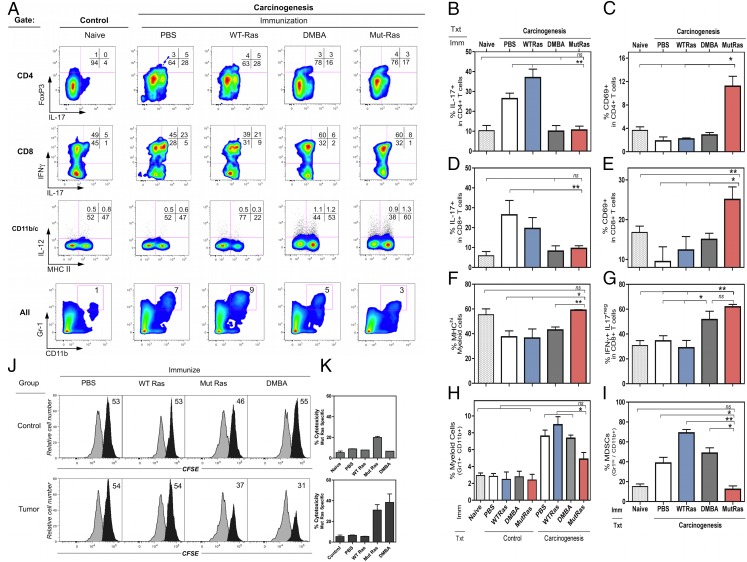
FIGURE 5.
Phenotypic and functional characterization of tumor-bearing vaccinated mice: (A) Flow cytometry multivariate plots. (B–I) Subset quantification in LNs (duplicate mice; mean ± range): (B) IL-17+ CD4 T cells; (C) CD69+ CD4 T cells; (D) IL-17+ CD8 T cells; (E) CD69+ CD8 T cells; (F) IL-12+ MHChi cells; (G) IFN-γ+ IL-17− CD8 T cells; (H) Gr1+ CD11c+ cells. Control: mice are vaccinated, DMBA treated, but not TPA treated. Carcinogenesis: mice are vaccinated, DMBA and TPA treated for 20 wk. (I) Gr-1hi, CD11b+ cells. Fold change from control (dotted line). Student t test: *p < 0.05, **p < 0.01. (J and K) In vivo CTL activity detected in immunized control and tumor-bearing mice. (J). Histogram display of CFSElo and CFSEhi target cells in the spleen, 1 d after target cell transfer. Gated CFSE-labeled target cells: CFSElo control (white) and the % of CFSEhi peptide–pulsed population (black) per sample (n = 3). (K) The % of Mut-H-ras–specific cytotoxicity for each group (mean ± SEM).

