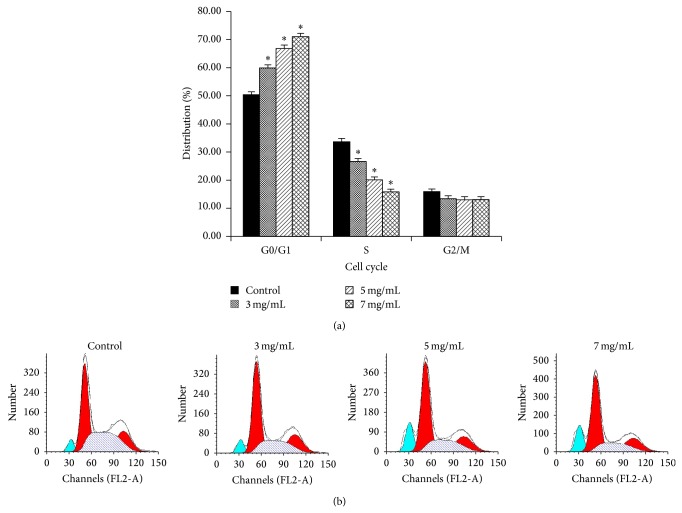
Figure 2.
Changes of cell cycle distribution in Hep-2 cells after treatment with oxymatrine at different concentrations for 72 h. (a) Oxymatrine increased the proportion of cells in G0/G1 phase and decreased that in the S phase, compared with the control group (* P < 0.05). (b) FCM analysis showed oxymatrine arrested Hep-2 cell cycling in the G0/G1 phase.

