
Figure 8.
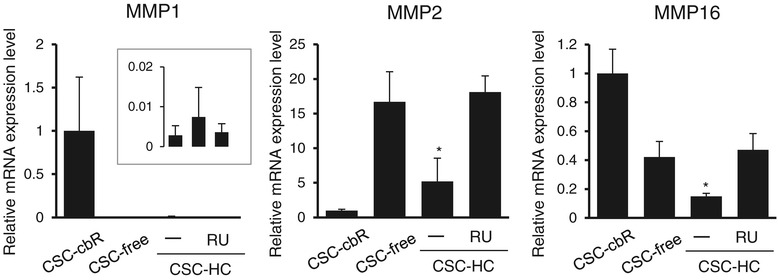
Matrix metalloproteinase mRNA expression profile in HBMEC/ciβ cultured with each medium. MMP-1, -2, and -16 mRNA expression levels in cells cultured with CSC-cbR, CSC-free, or CSC-HC were examined by qPCR. The effect of a GR antagonist, RU486, on HC-mediated modulation of mRNA expression was also investigated. The inset of the figure of MMP-1 shows magnified results obtained from cells cultured with CSC-free and CSC-HC (in the absence or presence of RU486) (left, middle, and right bar, respectively). mRNA expression levels were calculated relative to the value obtained from cells of CSC-cbR (set as basal level =1). Each value in the above experiments is expressed as mean ± S.D. obtained from three independent experiments. The “-” symbol indicates that DMSO (0.1%) was added to the medium as a control. The asterisk indicates p < 0.05 compared to the value of CSC-free.