
Figure 9.
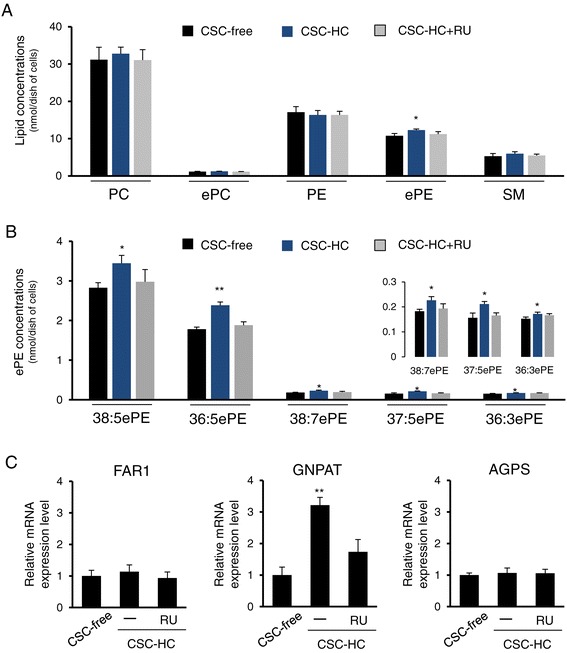
Identification of unique ether-phosphatidylethanolamine increases in HBMEC/ciβ cultured with CSC-HC. (A) Total lipids were extracted from cells cultured with CSC-free, CSC-HC or CSC-HC + RU486, and then subjected to LC-TOFMS analysis with a primary focus on the major lipid molecules that make up cell membranes. Each lipid concentration was normalized with that of the internal standard, and each bar represents a mean ± S.D. obtained from three independent experiments. (B) ePE concentrations were further determined using the same method. Among the twenty-one ePE molecules showing effective signal intensity, the results of five molecules (38:5ePE, 36:5ePE, 38:7ePE, 37:5ePE, and 36:3ePE) are shown. The inset shows magnified results of three minor species. Each lipid concentration was normalized with that of internal standard, and each bar represents a mean ± S.D. obtained from three independent experiments. (C) FAR1, GNPAT and AGPS mRNA expression levels in cells cultured with CSC-free or CSC-HC were examined by qPCR. The effect of RU486 on the HC-mediated induction of mRNA expression was also investigated. mRNA expression levels were calculated relative to the values obtained from CSC-free cells (set as the basal level =1). Values are expressed as means ± S.D. obtained from three independent experiments. In all the above, single and double asterisks indicate p < 0.05 and p < 0.01, compared to the CSC-free value.