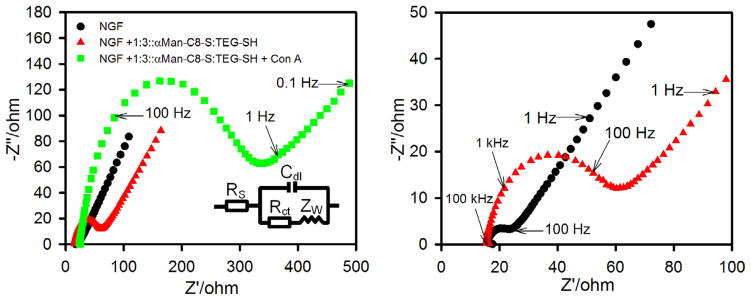
Figure 7.

Nyquist plots for Faradic impedance spectra of nanostructured gold films (NGFs) in 10 mM PBS (pH 7.4) containing 5 mM K3[Fe(CN)6] and 5 mM K4[Fe(CN)6]: unmodified NGF (black circles), NGF modified by mixed SAM of αMan-C8-SH and TEG-SH (red triangles), and after Con A binding from a 0.5 μM (50 μgmL−1) solution (green squares). The impedance spectra were recorded in the frequency range of 100 kHz to 0.1 Hz at 0.2 V bias potential (vs Ag|AgCl (KCl, satd) and with AC potential amplitude of 10 mV. Inset is equivalent circuit used to model impedance data. The panel on the right shows an expanded view of the higher frequency data for the bare NGF and the SAM-modified NGF. (For interpretation of the references to color in this figure legend, the reader is referred to the web version of this article.)
