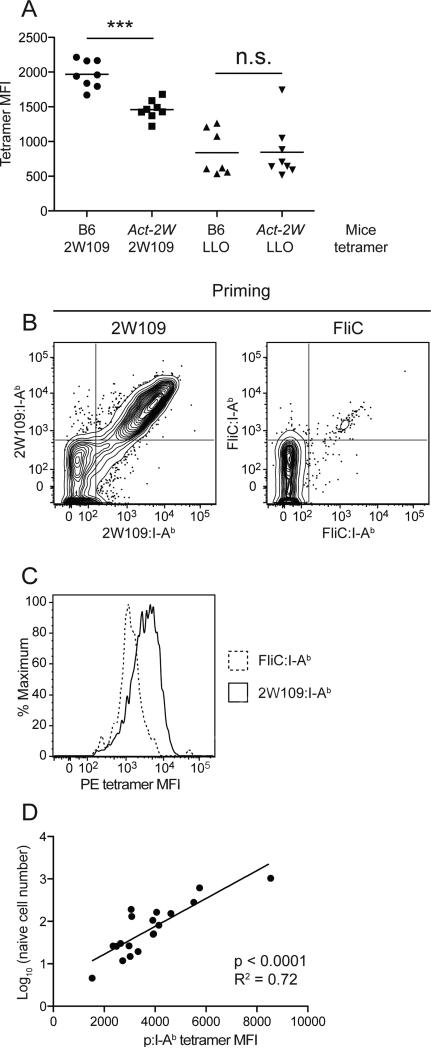
Figure 5. Small p:MHCII-specific T cell populations are comprised of cells with low affinity TCRs.
(A) Mean fluorescence intensity (MFI) for I-Ab tetramer staining of naïve CD4+ T cells from the indicated mice (***p < 0.0001, n.s. = not significant). The depicted results were pooled from 2 independent experiments.
(B) Contour plots of CD4+ T cells from spleen and draining lymph nodes of B6 mice 14 days after priming with 10 μg of the indicated peptide emulsified in CFA enriched with the indicated p:I-Ab tetramers labeled with streptavidin-PE or streptavidin-APC.
(C) Histogram overlays of 2W109:I-Ab streptavidin-PE or FliC:I-Ab streptavidin-PE tetramer binding for cells from the upper right quadrants of (B).
(D) Linear regression analysis of the log10 naïve cell number versus the tetramer MFI for 19 different p:I-Ab-specific populations from peptide-primed B6 mice. Each point represents values for an individual peptide. For each point, the Y-axis value represents the mean from Figure 1C for an individual peptide and the X-axis value the mean for that peptide from 2 independent experiments,

