
Figure 3. ATP and Pearson's r.
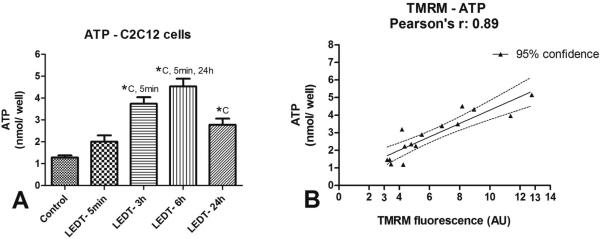
A) Analysis of adenosine triphosphate (ATP) content between groups. B) Pearson product-moment correlation coefficient (Pearson's r)between ATP and mitochondrial membrane potential using TMRM. Abbreviations: LEDT= light-emitting diode therapy; TMRM= tetramethyl rhodamine methyl ester; nmol= nanomol; AU= arbitrary units; C= control group; 5min= LEDT-5min group; 24h= LEDT-24h group; *= statistical significance (P < 0.05) using one-way analysis of variance (ANOVA).