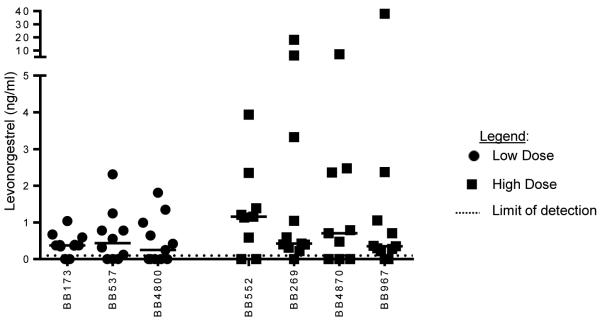
Figure 2. Drug Levels.

LNG and EE were measured one week prior to COC, during COC administration and one week after withdrawal. The low dose group is denoted with black dots and the high dose group is black squares. Ethinyl Estradiol levels in both groups were not detectable. Limit of detection was 0.1 (ng/ml) for LNG and (0.006 ng/ml) for EE. No synthetic hormones were detected in the baseline samples. The median amount of LNG measured for the low dose and high dose groups were 0.3763ng/ml LNG + 0.5919ng/ml respectively.
