
Figure 7.
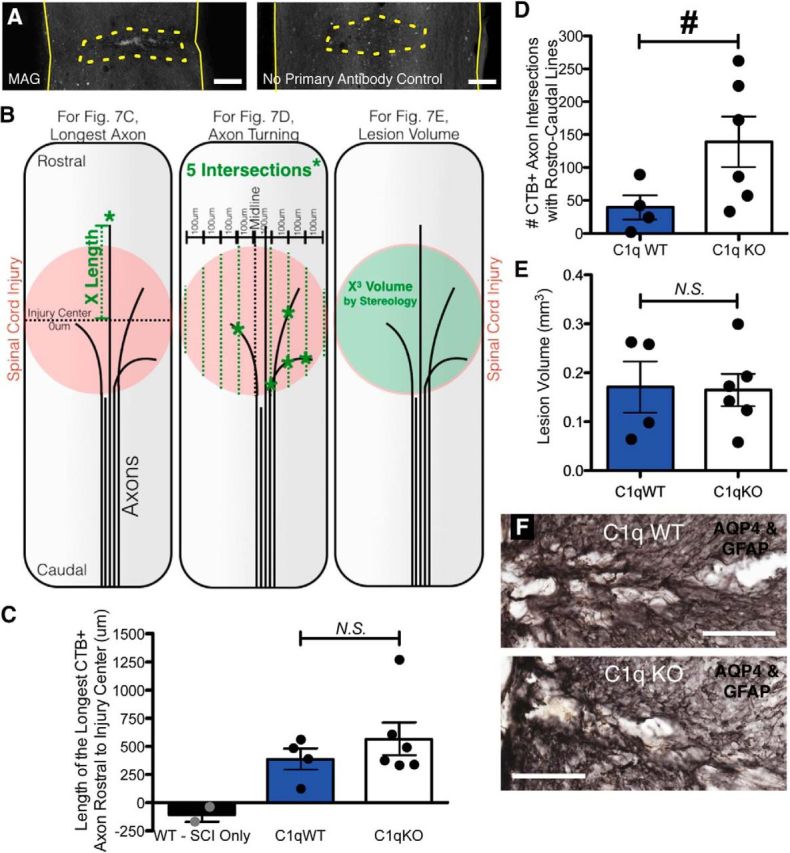
Increased axon turning in the lesion after SCI with conditioning lesion in C1q KO mice. A, MAG is detected in the lesion (dotted outline) by immunofluorescence (left), but not in primary antibody omitted control (right). B, Diagrams depicting methods for quantification of longest axon (C), axon turning (D), and lesion volume (E). Length of the longest CTβ-labeled axon rostral to the injury center (dotted black line, 0 μm) was determined for each mouse by measuring the distance from the injury center to the most rostral labeled point (green dotted line). To evaluate axon turning within the lesion, the number of traced axon intersections (green asterisks) with a series of eight parallel rostrocaudal oriented lines spaced 100 μm apart (green dotted lines) centered around the midline (black dotted line) was recorded. Lesion volume was estimated from tissue morphology using stereology, with the Cavalieri probe. C, C1q KO mice did not differ from WT littermates in longest axon length. D, C1qKO mice displayed a significant increase in axon turning, suggesting a role for C1q in axon guidance after SCI. E, No differences in lesion volume were detected between genotypes. F, Double immunolabel (black) for AQP4 and GFAP at lesion from representative C1q WT and C1q KO mice. All values are mean ± SEM. For spinal cord images, rostral is up. Scale bars: A, 500 μm; F, 250 μm. n = 4 C1q WT, 6 C1q KO (mice with evidence of either incomplete dorsal column lesion or insufficient tracer immunoreactivity were excluded from analysis: excluded Ns = 4 C1q KO, 3 C1q WT, and 3 SCI only); for D, *p < 0.05 t test; for C and E, p > 0.05 t test.