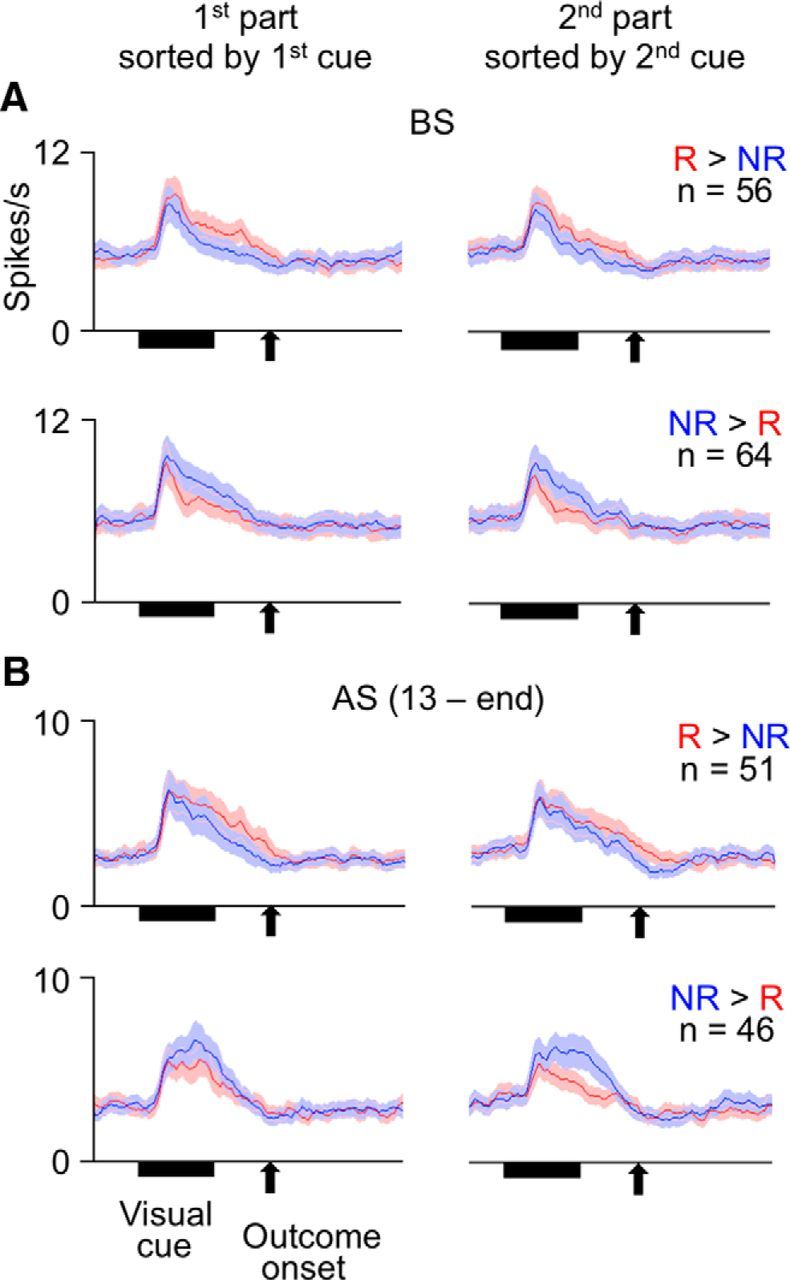
Figure 11.

Mean activities of cue-responsive TE cells. Left graphs, Activities in the first part of the trial sorted by the first cue. Right graphs, Activities in the second part of the trial sorted by the second cue. The cells were divided into two groups that showed numerically larger and smaller cue responses after reward-associated cues than after no-reward-associated cues (in responses averaged between the first and second parts of the trial). Red and blue lines indicate activities after reward-associated and no-reward associated cues, respectively. Bin width was 10 ms, and values were smoothed over five bins with equal weights. Shading represents SEM across cells. A, For the cells recorded before the first context switch (BS). B, For the cells recorded between the 13th day after the first context switch and the last day before the second context switch: AS (13 − end).
