Figure 4.

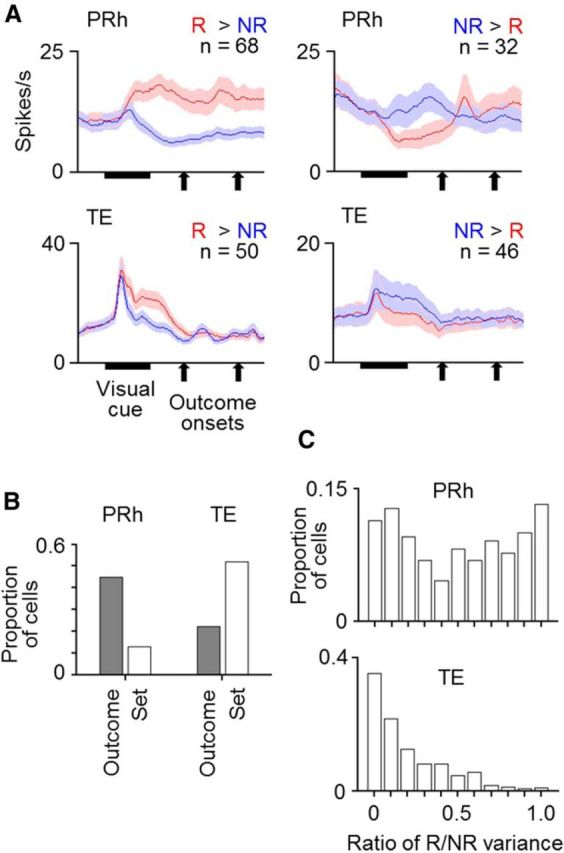
Responses of cells in PRh and TE to visual cues. A, Mean activities averaged over cells that showed significant selectivity for associated outcome types in their cue responses. Red and blue lines indicate activities in rewarded (R) and unrewarded trials (NR), respectively. Activities were separately averaged for PRh and TE cells and for the cells with larger and smaller responses in rewarded trials than in unrewarded trials. Bin width was 10 ms, and values were smoothened over five bins with equal weights. Shading represents SEM across cells. B, Proportions of cells that showed significant selectivity for associated outcome types (Outcome) and stimulus sets (Set) in PRh and TE. C, Proportions of cells having a value within the bin range of the ratio of (the variance due to associated outcome types)/(the variance due to associated outcome types + the variance due to stimulus sets) in PRh and TE.
