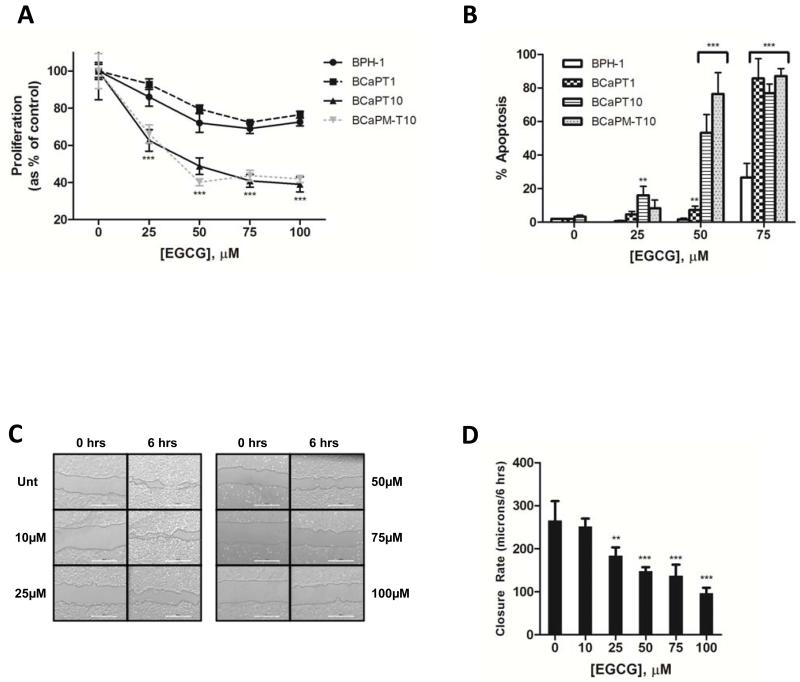
Figure 2.
(A) Cells were analyzed for DNA content after incubation with EGCG. Data represent a mean of 4-6 replicates ± SD. (B) Apoptotic cells were quantified by TUNEL staining after incubation with EGCG. Data represent mean percentage of positive TUNEL cells in 3 random fields of view ± SD. (C, D) Motility of BCaPT10 cells was determined ± EGCG exposure by scratch assay. Data represent mean distance traveled from 3 random fields of view ± SD. Experiments were repeated 3 times; representative results shown. **p<0.01, ***p<0.001 by one-way ANOVA or unpaired t-test by comparing to (A, B) BPH-1 at the same concentration or (D) untreated cells.

