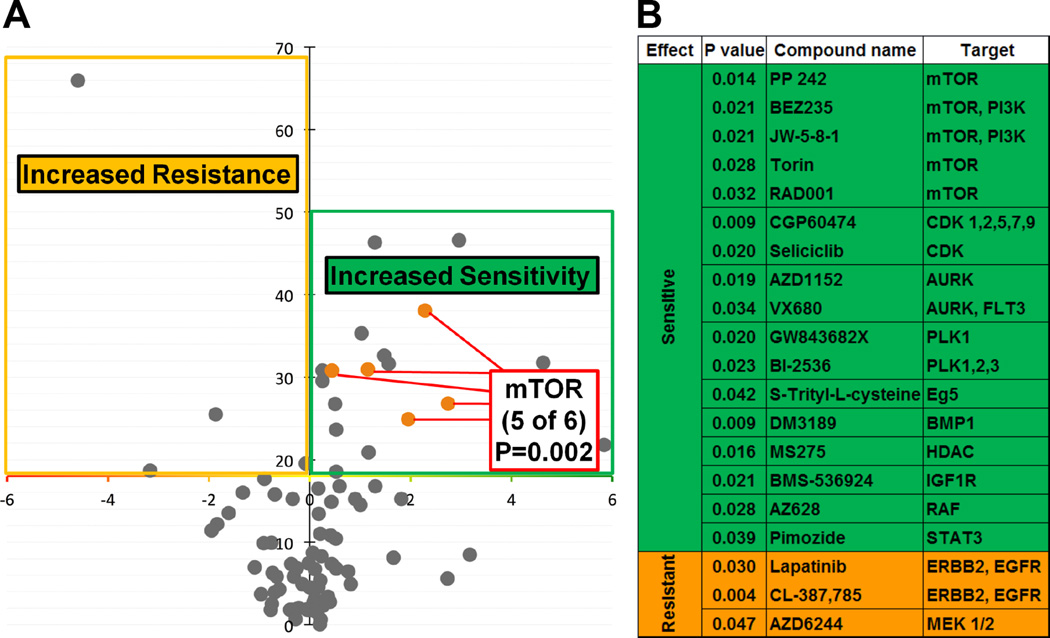
Figure 3. KDM4A SNP-A482 impacts cellular sensitivity to specific drugs.
(A) Volcano plot representing statistical significance (inverted Y axis) versus the effect of KDM4A SNP-A482 on drug sensitivity. Compounds above the X axis are statistically significant (p<0.05). Eighty seven cell lines and eighty eight compounds were used; the statistical significance of the enrichment for mTOR inhibitors in the group of drugs linked to the SNP status is indicated (p=0.002). (B) A list of compounds with statistically different sensitivity in (A), their associated targets and corresponding p values are shown. p values were calculated with Fisher’s exact test. Also see supplementary Figure S2 and supplementary Table 1.

