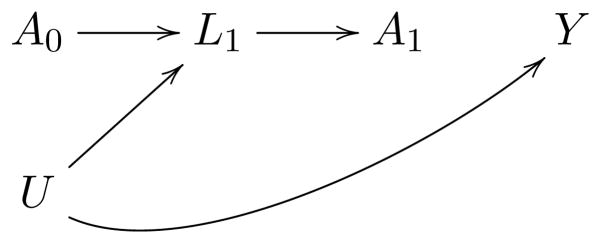
Figure 3. Causal diagram representing confounding for non-randomized therapies.

A0 represents assignment to the experimental arm, A1 the non-randomized treatment received at disease relapse, Y death, L1 prognostic factors that affect the clinicians’ choice of A1 (e.g. performance status, comorbidities, frailty scale, toxicity, center, type of health insurance coverage, bone marrow, liver and renal function), and U the unmeasured determinants of those factors and of death. Conventional statistical methods adjust for the factors L1 by conditioning on them, e.g., adding them as covariates in an outcome regression model, which will generally induce selection bias in the estimates.
