
Fig. 2.
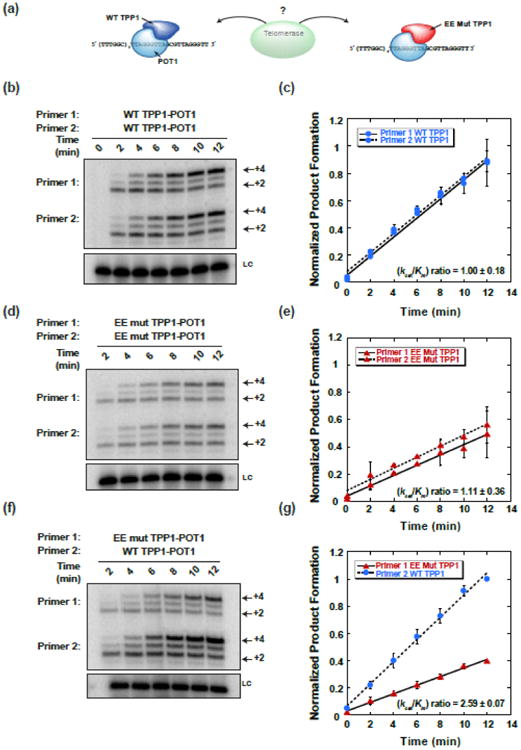
The TEL-patch contributes to substrate recruitment and extension by telomerase. (a) In vitro telomerase competition assays between two primers: a 38 nt primer bound with wild-type TPP1-POT1 and a 44 nt primer bound by TEL-patch mutant TPP1-POT1, cartoon depicts competition shown in panel f and quantitated in panel g. (b) Competition between primer 1 and primer 2 each pre-bound to wild-type (WT) TPP1-POT1. (c) Initial velocity plot for the competition shown in b. Blue circles indicate wild-type TPP1-POT1. (d) Primer 1 and primer 2 each pre-bound to E169A;E171A (EE mut) TPP1-POT1. (e) Initial velocity plot for the competition shown in d. Red triangles indicate E169A;E171A TEL-patch mutant TPP1-POT1. (f) Primer 1 pre-bound to EE mut TPP1-POT1 and primer 2 pre-bound to WT mut TPP1-POT1. (g) Initial velocity plot for competition shown in f, colors and symbols are the same as c,d. Time (min) after simultaneously mixing telomerase and both substrates denoted above gels, and +2 and +4 products indicated on the right side of the gels. Precipitation and loading control (LC) shown below each competition panel. Product formation was calculated by summing the counts of the +2, +3, and +4 products, normalized to the loading control and expressed as a fraction of the total counts incorporated for primer bound by WT TPP1-POT1 at 12 min for each replicate. The average normalized product formation for each competition was plotted as a function of time and fit by linear regression, and the initial velocity of product formation was determined by the slope of the line. Error bars represent the standard deviation in normalized product formation at each time point for the replicates (n = 2). Throughout this work, kcat/Km ratios calculated using the equation: (kcat/Km)primer2/(kcat/Km)primer1 = (νprimer2/νprimer1)*([primer1]/[primer2]). Final concentration of each primer was 100 nM.