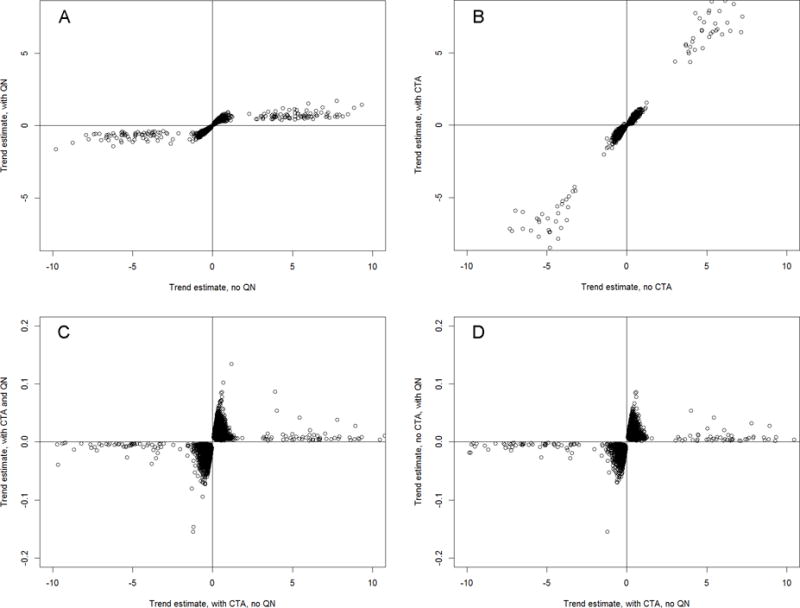
Figure 3.

The effect of cell-type composition adjustment and quantile normalization on temporal trend in DNA methylation: scatter plots of trend estimates. (A) Untransformed vs. quantile-normalized data, no cell-type adjustment. (B) Untransformed data: without vs. with cell-type adjustment. (C) Untransformed vs. quantile-normalized data, with cell-type adjustment., (D) Untransformed data with cell-type adjustment vs. quantile-normalized data without cell-type adjustment. All plots show only CpG loci with significant trend in both models. CTA: cell type adjustment; QN: quantile normalization.
